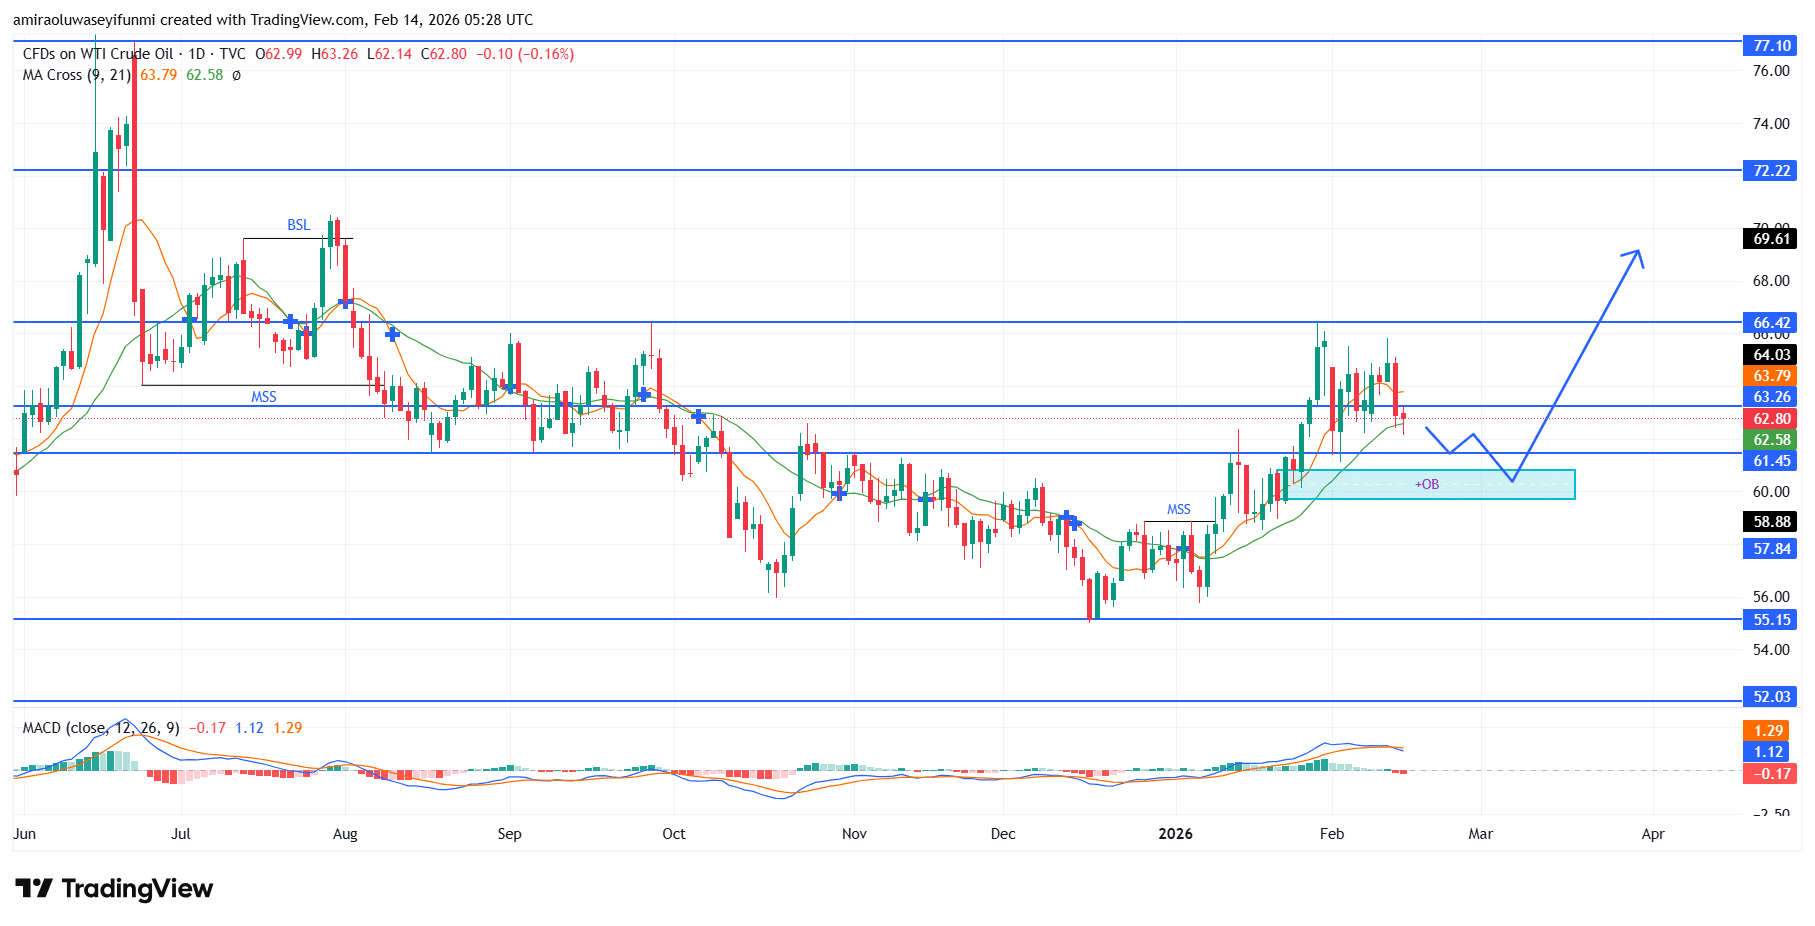
USOil bullish structure indicates growing strength and upward potential. The overall technical landscape demonstrates a steady rebuilding phase after an extended bearish period, with key momentum metrics increasingly favoring buyers. The moving average alignment confirms that the faster average remains positioned above the slower average, validating upward directional pressure, while price stability above the $62.580 equilibrium zone reinforces constructive positioning. At the same time, the MACD histogram continues to print slightly positive readings despite minor contraction, signaling that upward momentum remains intact and pointing toward underlying accumulation activity.
USOil Key Levels
Resistance Levels: $66.420, $72.220, $77.100 Support Levels: $61.450, $55.150, $52.030
USOil Long-Term Trend: Bullish
In terms of market behavior, USOil has reversed its prior downtrend pattern and established a higher-low sequence, signaling a confirmed transition toward buyer dominance. The recent decline from around $64.000 into the $61.450–$62.580 demand band represents a controlled corrective movement into a recognized institutional support area. Importantly, price action continues to hold above the key structural base at $60.000, maintaining the integrity of the bullish framework and reflecting sustained defensive participation from buyers.
Going forward, continued price acceptance above $61.450 is likely to support renewed upward continuation, with the first objective positioned near the $66.420 resistance level. A decisive move beyond this barrier would strengthen bullish conviction and open the path toward $69.610, with further extension toward $72.220 and potentially $77.100 if momentum strengthens. In summary, the current technical configuration favors continued upside progression, with temporary pullbacks presenting favorable positioning opportunities within a strengthening trend environment.
USOil Short-Term Trend: Bearish
USOil is showing early signs of bearish exhaustion after failing to sustain momentum above the $64.310 resistance zone. Price has crossed below the short-term moving average near $62.970 and is now trading beneath dynamic resistance, indicating weakening bullish control.
The rejection structure and lower-high formation suggest an increasing probability of a downside move toward the liquidity zone between $61.450 and $60.000. A confirmed breakdown below $61.450 would likely accelerate selling pressure, exposing $58.880 as the next bearish target, and traders monitoring forex signals may use these developments to refine short-term positioning strategies.
Note: Learn2.trade is not a financial advisor. Do your research before investing your funds in any financial asset, product, or event. We are not responsible for your investment results.
Trade on MT4 with Leverage up to 1:500! Trade on MT4 with Leverage up to 1:500!
X
We use cookies to ensure that we give you the best experience on our website. If you continue to use this site we will assume that you are happy with it.