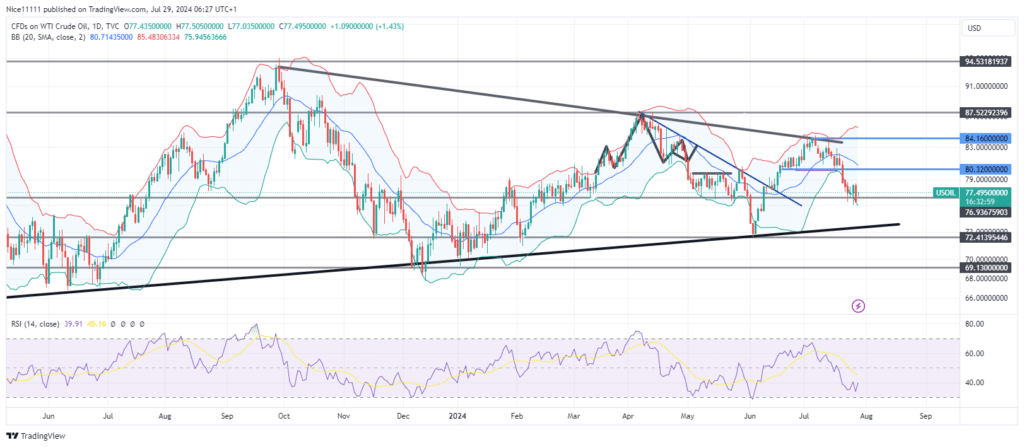
The USOil current bearish trend is driven by a retest of the resistance trendline of the large symmetrical triangle on the daily chart. The previously strong upward trend reversed sharply as sellers entered the market upon reaching the resistance border. The price is now dipping towards the supporting border of the symmetrical triangle.
A three falling peaks chart pattern began forming as the price reached the resistance band of the Bollinger Bands. This provided further justification for short positions as the price hit the resistance border of the parallel channel. The Relative Strength Index (RSI) was nearing the overbought region, indicating bearish readiness.
The USOil price eventually dipped below the Moving Average string within the Bollinger Bands upon testing the resistance trendline. Currently, the RSI shows the market is bearish and approaching the oversold region. This is consistent with the price nearing the supporting border of the symmetrical triangle below 76.90.
USOil Short Term Trend: Bearish
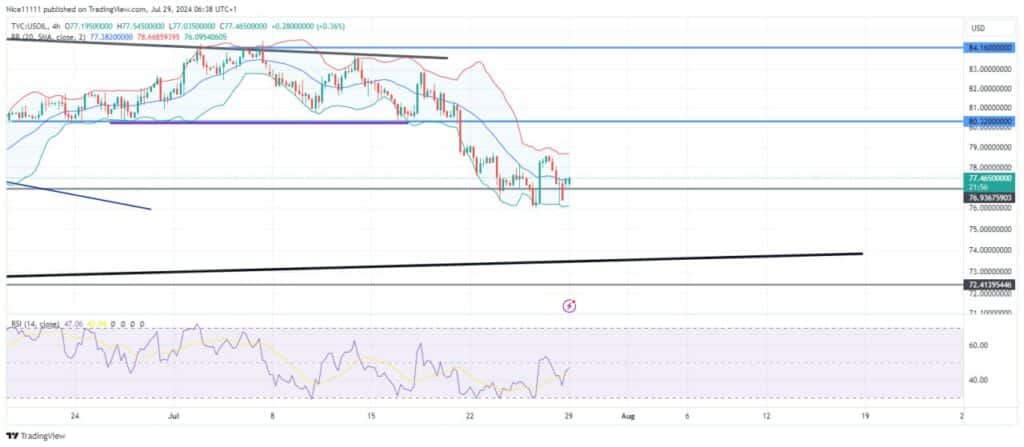
On the lower timeframe, sellers are struggling to push the price below 76.90. This is evident with the formation of a double bottom at the demand zone while the price has moved above the midline of the Bollinger Bands. It is crucial to watch for a Return to Order block (RTO) on the 4-hour chart. Failure of the bullish order block in the double bottom pattern is a strong signal to continue shorting towards the next demand level of 72.40.
Traders should consider using forex signals to identify optimal entry and exit points during this bearish trend.
Note: Learn2.trade is not a financial advisor. Do your research before investing your funds in any financial asset, product, or event. We are not responsible for your investment results.
Trade on MT4 with Leverage up to 1:500! Trade on MT4 with Leverage up to 1:500!
X
We use cookies to ensure that we give you the best experience on our website. If you continue to use this site we will assume that you are happy with it.