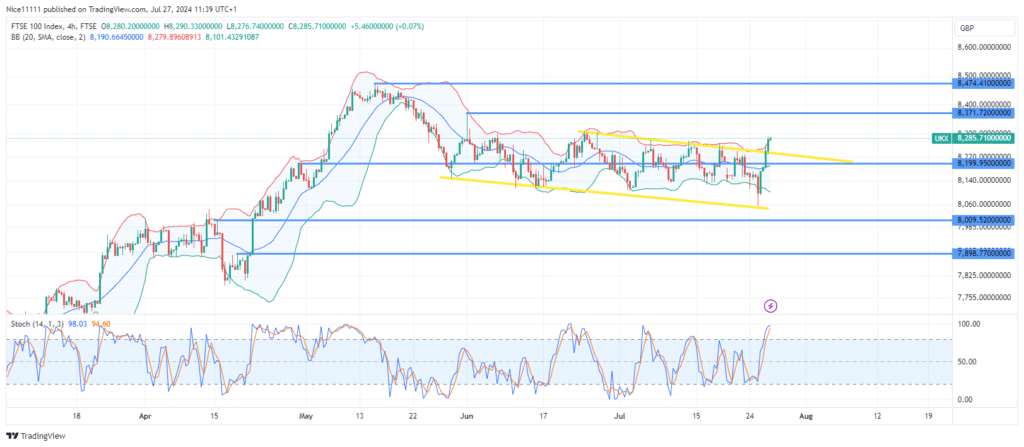
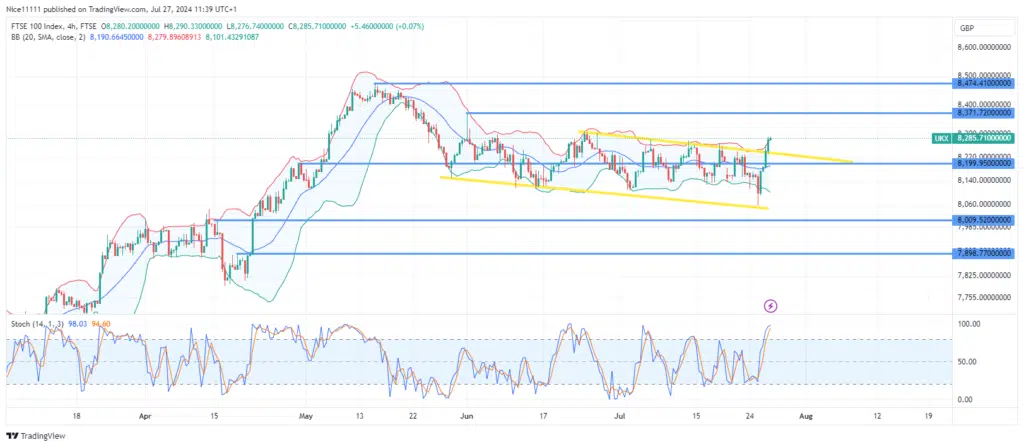
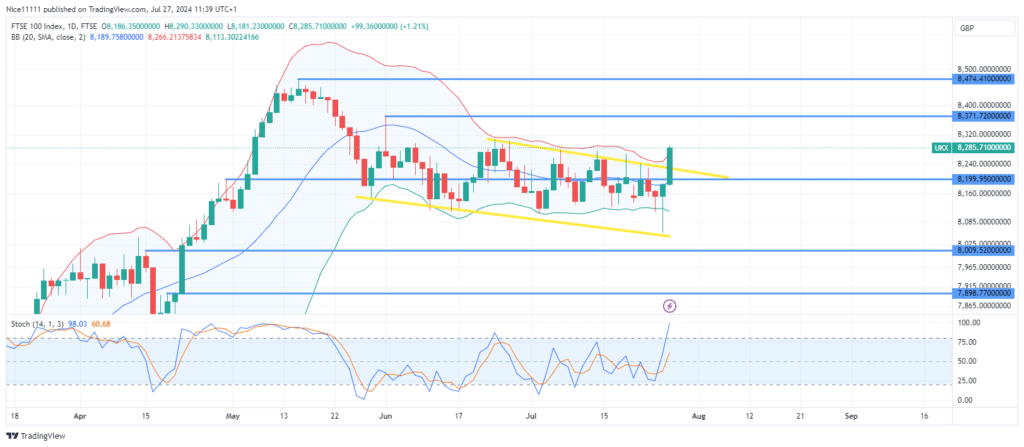
The FTSE 100 market has been consolidating since its pullback to the demand level of 8199.0. This consolidation led to the formation of a bearish parallel channel on the daily chart. Recently, the price has expanded above this channel, indicating a bullish takeoff.
The consolidation at 8199.0 was well-expressed with the Bollinger Bands, as the price oscillated between the upper and lower bands. This movement highlighted the market’s indecision and the tug-of-war between buyers and sellers. The volatility during this period was contained within the bands, indicating a phase of accumulation. This is evident on trading platforms.
On July 25, a hammer candle with a long wick tested the lower border of the parallel channel, leading to an impulsive upward price movement. This hammer candle, a strong reversal signal, was followed by a large bullish candle the next day. The bullish candle decisively broke through the resistance border of the parallel channel, signaling a potential shift in market sentiment from bearish to bullish.
FTSE 100 Short-Term Trend: Bullish
The FTSE 100 price is currently rallying towards the swing high of 8371.0. The Stochastic indicator has risen to the overbought region following the breakout on both lower and higher timeframes. A retest of the channel may follow to sustain the bullish breakout. Traders should consider using forex signals to identify optimal entry and exit points during this bullish breakout.
Note: Learn2.trade is not a financial advisor. Do your research before investing your funds in any financial asset, product, or event. We are not responsible for your investment results.
Trade on MT4 with Leverage up to 1:500! Trade on MT4 with Leverage up to 1:500!
X
We use cookies to ensure that we give you the best experience on our website. If you continue to use this site we will assume that you are happy with it.