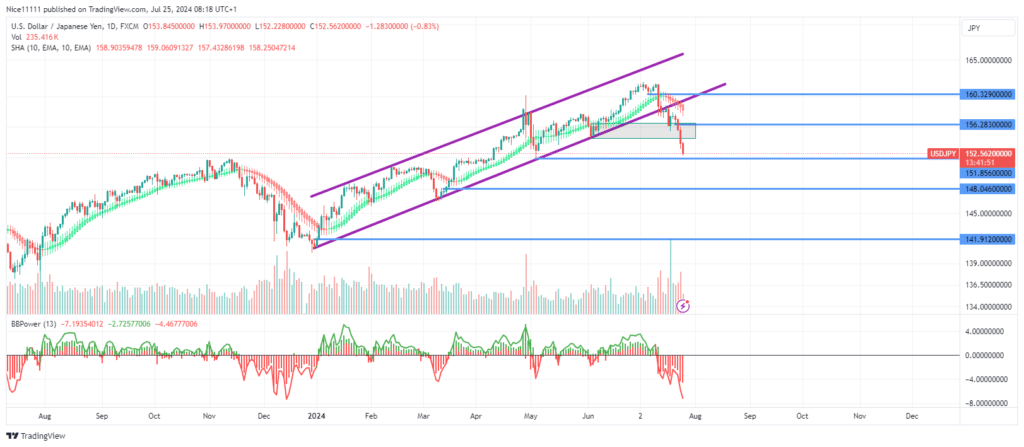
USDJPY – Guide, Tips & Insights | Learn 2 Trade – Guide, Tips & Insights | Learn 2 Trade price action formed a bullish parallel channel with very sensitive borders from January to June. This period saw only major pullbacks, which provided opportunities to find support after testing the resistance border within the bullish parallel channel. The price maintained a steady ascent with significant lows, sustaining the bullish stance for the first half of the year.
The Elder Ray Bull and Bear Power indicator revealed that buyers regained dominance at the start of the year, with a positive reading replacing the previous negative one, and the indicator phase changing from red to green. A double-bottom bullish reversal pattern then set the stage for a long-term ascent.
USDJPY – Guide, Tips & Insights | Learn 2 Trade – Guide, Tips & Insights | Learn 2 Trade price action has been very discernable, showing sensitivity by respecting the upper and lower borders of the parallel channel. Aside from the major pullback in March, the Smoothed Heikin Ashi candles have displayed a consistent green hue until now.
The bearish breakout from the bullish parallel channel was an early sign of a price reversal. Subsequently, the break of the demand level at 154.50 confirmed this trend reversal. The price is now rapidly declining, aiming to reach the next demand level at 151.90.
In summary, USDJPY – Guide, Tips & Insights | Learn 2 Trade – Guide, Tips & Insights | Learn 2 Trade has entered its first bearish trend of the year, with both long-term and short-term indicators pointing towards a continuation of the downtrend.
Trade on MT4 with Leverage up to 1:500! Trade on MT4 with Leverage up to 1:500!
X
We use cookies to ensure that we give you the best experience on our website. If you continue to use this site we will assume that you are happy with it.