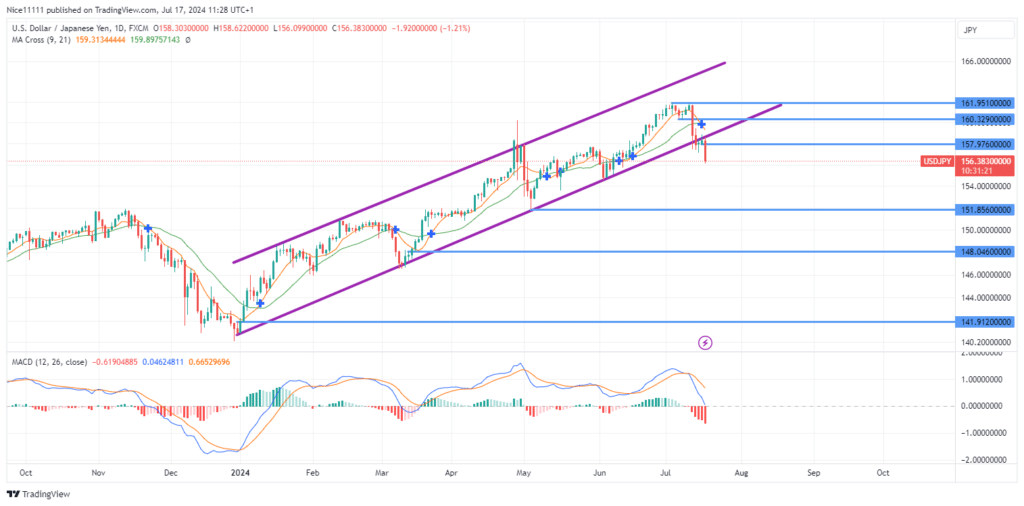
USDJPY – Guide, Tips & Insights | Learn 2 Trade – Guide, Tips & Insights | Learn 2 Trade has performed exceptionally well since the beginning of the year. The price soared through a bullish channel to reach a high of 161.950 before exhaustion set in. The supporting trendline of the bullish channel has failed to hold, leading to a bearish breakout.
After the fourth test of the bullish trendline, the price fell short of rising to retest the resistance border of the parallel channel. The Moving Averages have dominated the daily candles, indicating a change in market direction. The bearish breakout was also preceded by the MACD (Moving Average Convergence Divergence) signaling an overbought market.
Swing lows align on the buyside of the market towards the 151.860 resistance zone. This region features rich liquidity, which typically acts as a price magnet. The price decline is expected to draw towards these swing lows.
In the 4-hour timeframe, the chart shows more detailed price action. Upon the bearish breakout, a retest of the supporting trendline increased selling pressure, causing the price to dip further. The price appears poised for a significant decline.
In summary, USDJPY – Guide, Tips & Insights | Learn 2 Trade – Guide, Tips & Insights | Learn 2 Trade has transitioned from a strong bullish trend to a bearish outlook. Both long-term and short-term indicators suggest further downward movement, with key levels to watch for potential support and resistance. The best forex signals telegram channels often capitalise on breakouts in framing their setups.
Trade on MT4 with Leverage up to 1:500! Trade on MT4 with Leverage up to 1:500!
X
We use cookies to ensure that we give you the best experience on our website. If you continue to use this site we will assume that you are happy with it.

 USDJPY – Guide, Tips & Insights | Learn 2 Trade – Guide, Tips & Insights | Learn 2 Trade Short-Term Trend: Bearish
 USDJPY – Guide, Tips & Insights | Learn 2 Trade – Guide, Tips & Insights | Learn 2 Trade Short-Term Trend: Bearish


