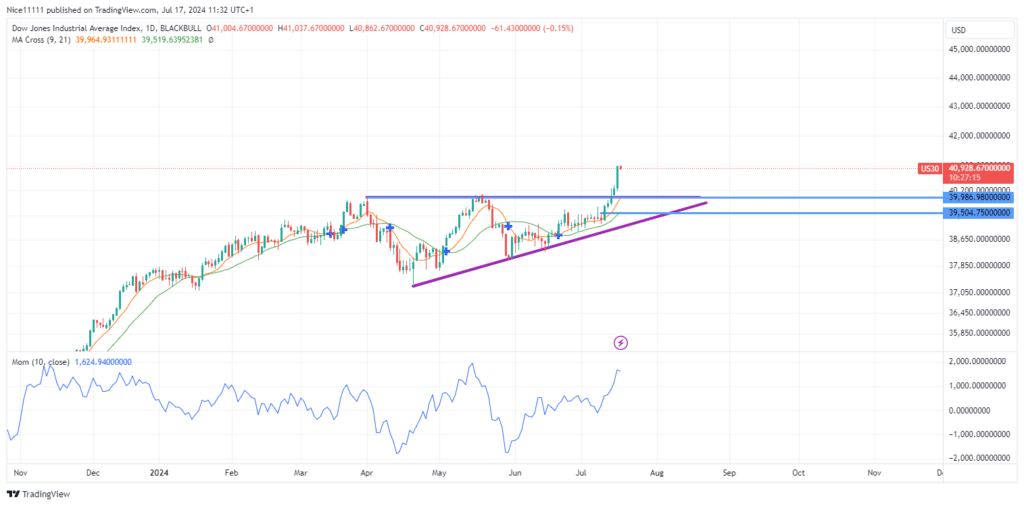
The US 30 index has broken through the significant resistance zone at 39,986.0 on the daily chart, reaching an all-time high. The index shows no signs of slowing down, maintaining strong bullish momentum.
In April and May, trading platforms helps us see that US 30 bulls made several attempts to soar beyond the supply zone of 39,987.0 but were initially unsuccessful. However, the formation of higher lows demonstrated the bulls’ resilience and determination to enforce a breakout.
Following a retest of the bullish order block at 38,560.0, the Moving Averages (Periods 9 and 21) repositioned themselves permanently beneath the daily candles, highlighting buyer dominance. For the second time this year, the Momentum Indicator is reading above +1.0, indicating strong buying momentum.
US 30 Short-Term Trend: Bullish
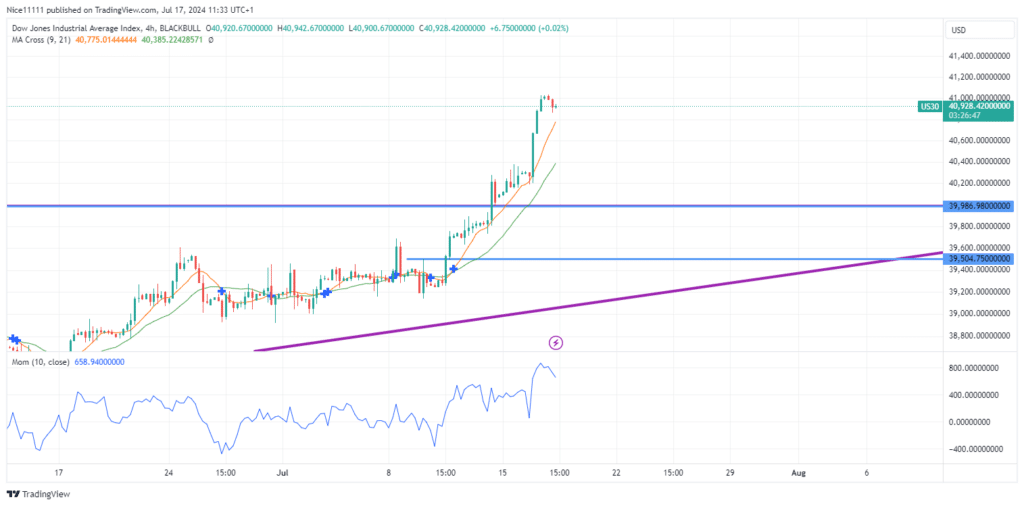
The presence of large-sized bullish candles, characterized by fair value gaps, underscores the strong bullish momentum. The lower timeframes also exhibit bullish trends, with incomplete pullbacks due to the upward pressure on the price. Many traders are eager to join this upward movement, viewing it as a strong opportunity for forex signals.
The US 30 index continues to demonstrate robust bullish behavior, with significant upward momentum across both long-term and short-term trends. The market’s current trajectory suggests a continuation of this bullish trend, making it a compelling point of interest for traders.
Note: Learn2.trade is not a financial advisor. Do your research before investing your funds in any financial asset, product, or event. We are not responsible for your investment results.
Trade on MT4 with Leverage up to 1:500! Trade on MT4 with Leverage up to 1:500!
X
We use cookies to ensure that we give you the best experience on our website. If you continue to use this site we will assume that you are happy with it.