Market Analysis – September 26
US 30 eyes downside for more dips. The price is looking at a potential downside trend, with both buyers and sellers strategizing their next move. It has been a roller coaster ride, with the price breaching the significant 34095.00 market level. This strategic zone forged an overhang for a considerable period before selling traders raked in the spoils.
US 30 Price Levels
Resistance Zones: 35758.90, 35119.60
Support Zones: 34095.00, 32576.60
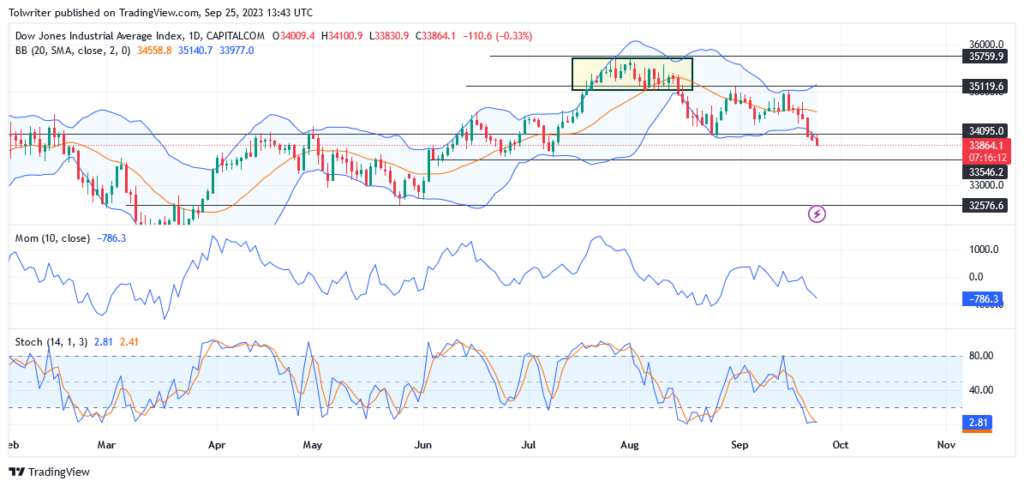
US 30 Long-Term Trend: Bearish
Delving into the performances of the previous months, there was parity in the market with an equilibrium between traders. Swing sellers did manage to disturb the balance initially when buyers closed in, near the 35759.90 benchmark. Resilient bears, who eventually managed to regain control after a few weeks, were what they met. This happened while the price maintained a consolidation above the 35119.60 price territory. The expanding bearish momentum indicates this alignment by the momentum indicator.
However, despite an influx in bear expansivity, sellers were unable to breach the 34095.00 market zone. This period saw the Dow Jones market maintain a steady balance between the buying force and selling pressure.
Fast forward to the present week, and there is a significant paradigm shift. The sellers are poised to strike lower in the market to break the 33546.20 next order level. A key indicator of this shift is the momentum indicator, currently clocked at -786.30. This indicator value suggests high sell trading activity that hints at a bearish trend, signifying the potential for losses.
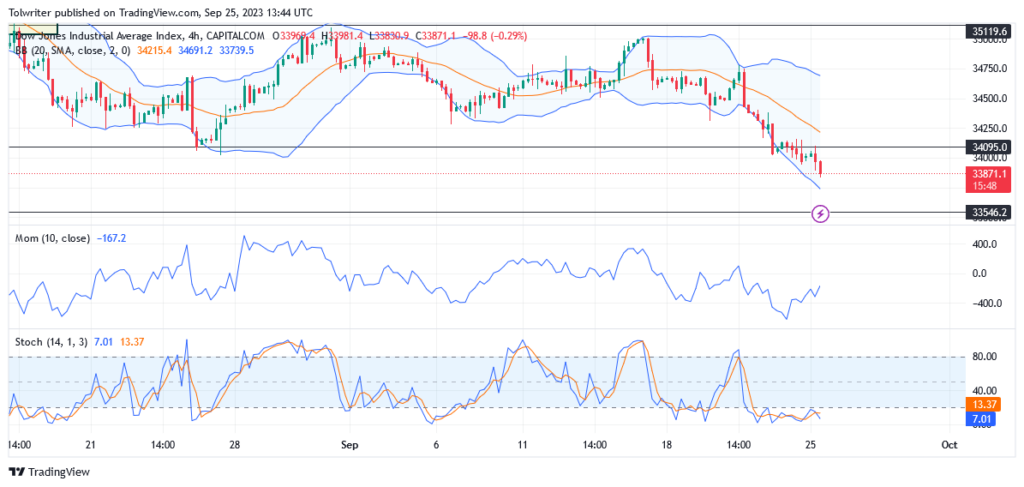
US 30 Short-Term Trend: Bearish
Further, the 4-hour chart of the US 30 continues to remain vulnerably open for bearish expansivity. We are more likely to witness a subsequent decline in the US 30 price.
To sum up, it will be crucial to keep track of the market’s shifting momentum. The US 30 displays bearish signs, with sellers showing strength. However, if the Stochastic Oscillator indicates an oversold market, buyers may just have a window to turn the tables.
You can purchase Lucky Block – Guide, Tips & Insights | Learn 2 Trade here. Buy LBLOCK
Note: Learn2.trade is not a financial advisor. Do your research before investing your funds in any financial asset or presented product or event. We are not responsible for your investing results
- Broker
- Min Deposit
- Score
- Visit Broker

- Award-winning Cryptocurrency trading platform
- $100 minimum deposit,
- FCA & Cysec regulated

- 20% welcome bonus of upto $10,000
- Minimum deposit $100
- Verify your account before the bonus is credited
- Fund Moneta Markets account with a minimum of $250
- Opt in using the form to claim your 50% deposit bonus
Learn to Trade
Never Miss A Trade Again

Signal Notification
Real-time signal notifications whenever a signal is opened, closes or Updated

Get Alerts
Immediate alerts to your email and mobile phone.

Entry Price Levels
Entry price level for every signal Just choose one of our Top Brokers in the list above to get all this free.