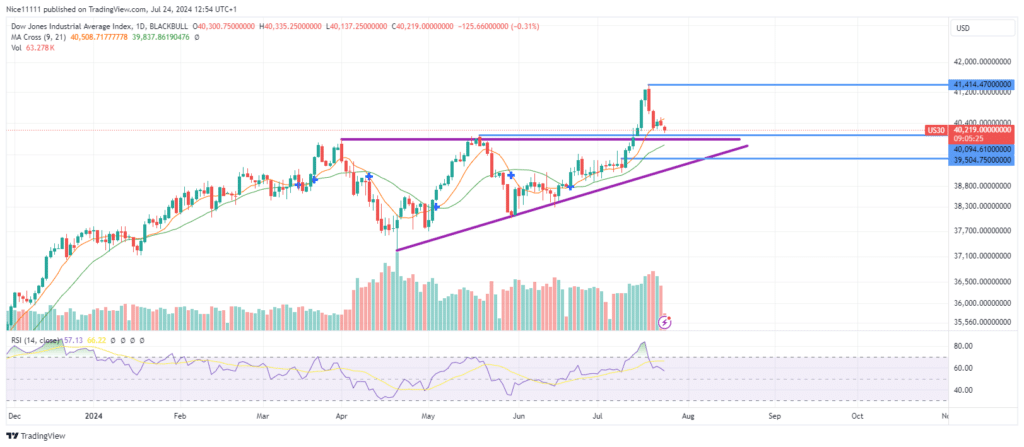
The US 30 index has successfully broken out from an ascending triangle on the daily chart. On July 12th, the well-defended resistance zone at 40,094.0 was breached. The price is currently undergoing a pullback after this breakout, seeking support to sustain the bullish stance.
Following the bullish breakout, the emergence of three white soldiers indicated strong bullish momentum. However, the Relative Strength Index (RSI) signaled exhaustion, leading to the formation of a swing high at 41,414.
The price is now experiencing a healthy pullback towards the demand level of 40,094. It has fallen below the 9-period Moving Average, indicating a retracement, but remains above the 21-period Moving Average, suggesting that the market is still bullish.
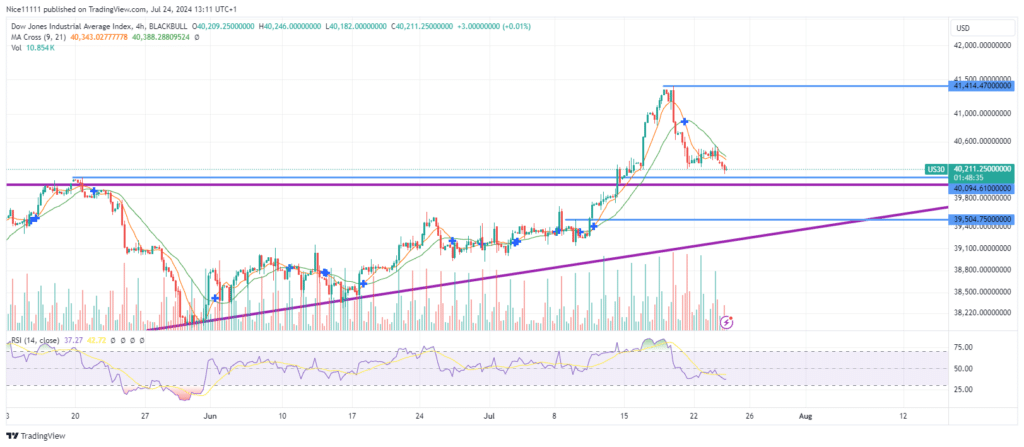
US 30 Short-Term Trend: Bearish
The lower timeframe (4-hour chart) is bearish, with the Moving Averages hovering above the daily candles. It is important not to get trapped in the short-term bearish trend as the market enters a demand zone on the 24-hour timeframe. A shift in market structure on the lower timeframe could establish safer bullish forex signals with a higher risk-to-reward ratio.
Note: Learn2.trade is not a financial advisor. Do your research before investing your funds in any financial asset, product, or event. We are not responsible for your investment results.
Trade on MT4 with Leverage up to 1:500! Trade on MT4 with Leverage up to 1:500!
X
We use cookies to ensure that we give you the best experience on our website. If you continue to use this site we will assume that you are happy with it.