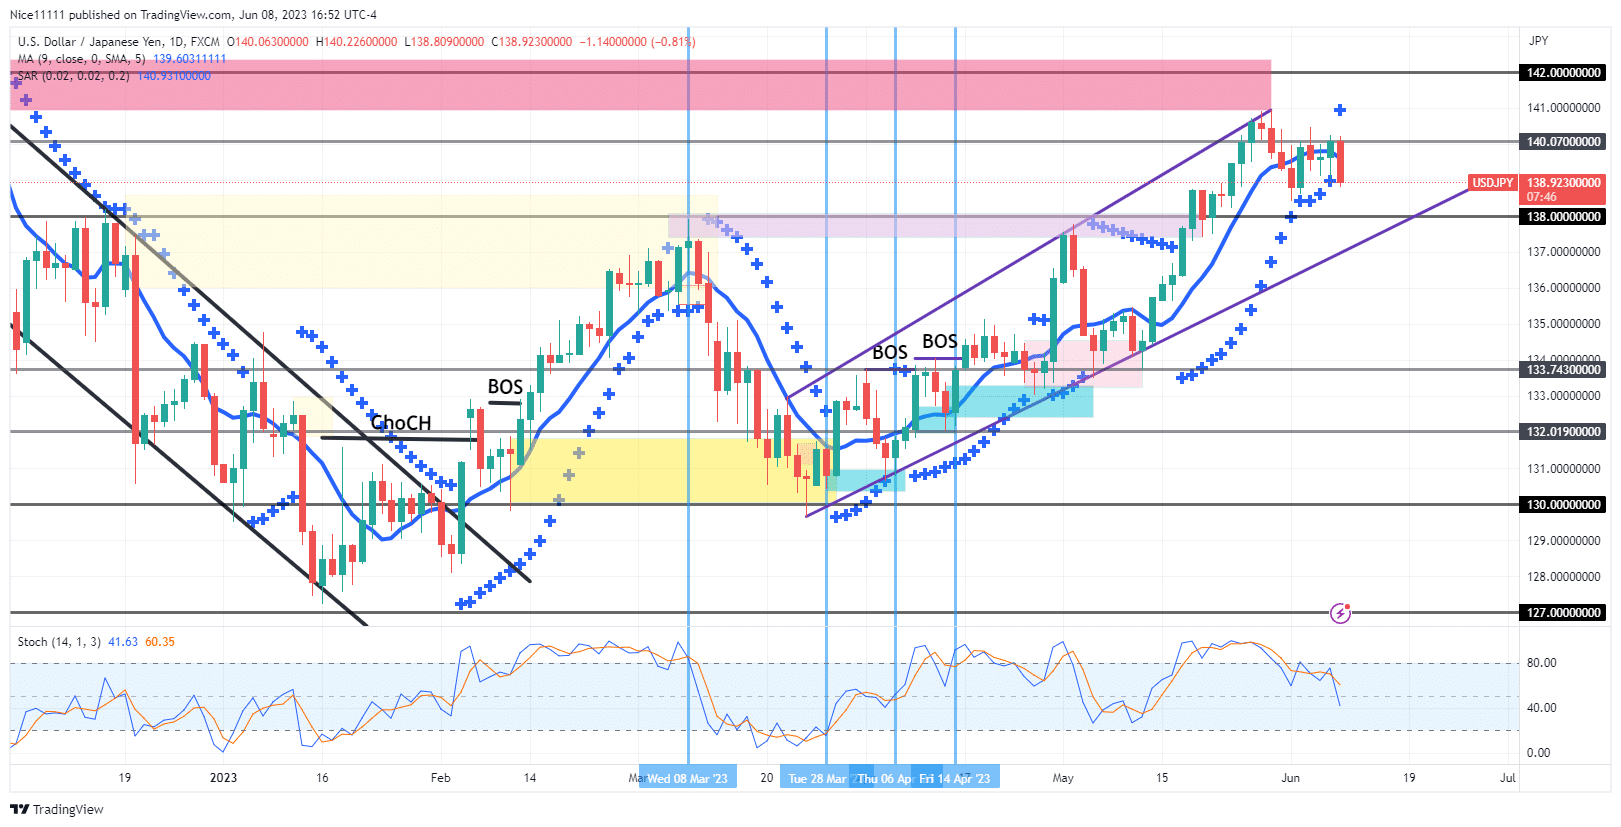
USDJPY – Guide, Tips & Insights | Learn 2 Trade – Guide, Tips & Insights | Learn 2 Trade is exhibiting strong indications of a significant sell-off in the market analysis. The bulls have encountered challenges in maintaining their position above the resistance level of 140.0. This is exemplified by the presence of a large, bearish daily candle, which signals the market’s inclination to decline.
USDJPY – Guide, Tips & Insights | Learn 2 Trade – Guide, Tips & Insights | Learn 2 Trade has been ascending within an expanding channel. Following a bullish reversal in March near the support level of 130.0, the price has risen by approximately 9%. However, after surpassing the 140.0 supply level, the market experienced a downward shift, with three consecutive black crows falling below the moving averages. The closing prices of the daily candles consistently settled below the Moving Average (period 9), indicating a bearish sentiment.
Moreover, the Parabolic SAR (Stop and Reverse) has also ceased supporting the upward movement, as evidenced by its placement above the current daily candle. follow, the price will likely decline towards the 138.0 level.
The 4-hour chart reveals a shift in market structure from bullish to bearish. The market appears to be in an accumulation phase, characterized by price fluctuations within a relatively fixed range. consequently, a downward movement towards 138.0 is expected during this period.
Trade on MT4 with Leverage up to 1:500! Trade on MT4 with Leverage up to 1:500!
X
We use cookies to ensure that we give you the best experience on our website. If you continue to use this site we will assume that you are happy with it.