Don’t invest unless you’re prepared to lose all the money you invest. This is a high-risk investment and you are unlikely to be protected if something goes wrong. Take 2 minutes to learn more
The STORJ/USD has experienced a significant price movement yet remains more prone to downward retracement. Also, price action in this market seems to have entered a volatile storm. This makes it more challenging to analyze where prices may head soon. Nevertheless, let’s give it a try.
Storj Analysis Data
Storj Value Now: $0.2700
STORJ Market Cap: $128M
STORJ Moving Supply: 399,388,005.3
Storj Total Supply: 424,999,998
STORJ CoinMarketCap Ranking: 175
Major Price Levels:
Top: $0.2700, $0.2750, and $0.2800
Base: $0.2650, $0.2600, and $0.2550
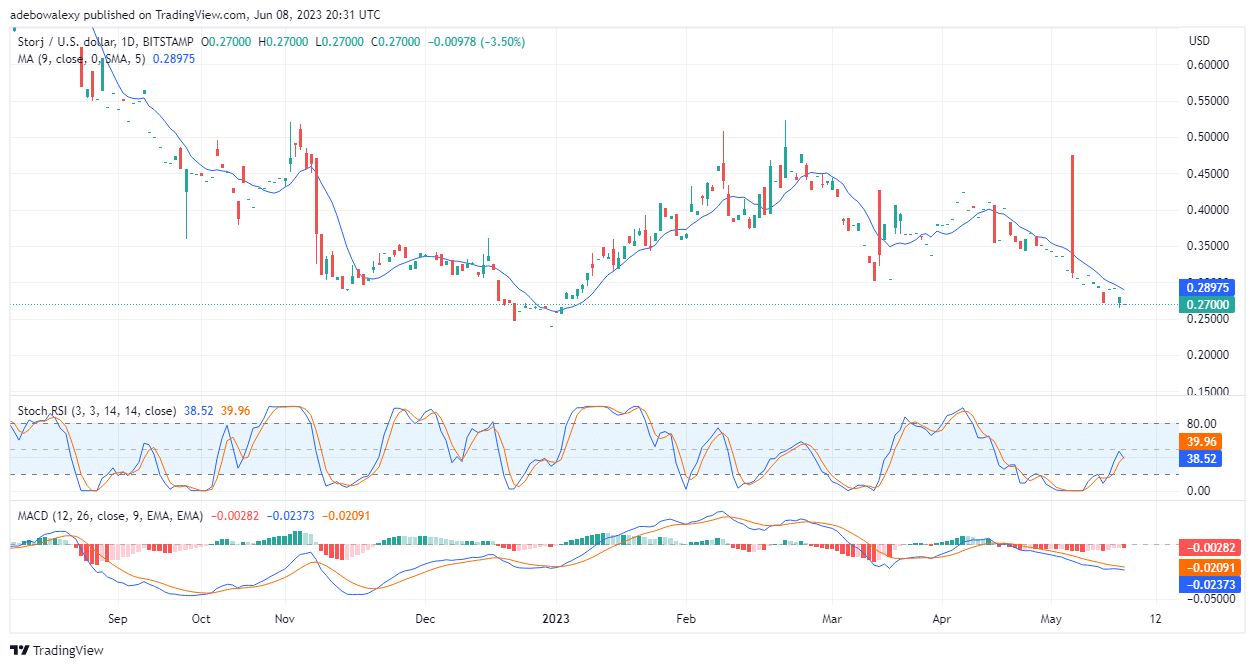
STORJ/USD Fails to Impress Buyers
Price action in the STORJ/USD market seems to have largely failed to draw the attention of buyers. Despite the price movement of 7.25% recorded for this crypto on the crypto daily movers list, it does appear like many movements have occurred in this market anyway. Here, the latest price candle has formed at a lower level than the previous green price candlestick. Also, price action remains below the 9-day Moving Average curve. In addition, the Stochastic Relative Strength Index (RSI) indicator lines can be seen giving another bearish crossover just below the 40 mark of the indicator. All the perceived indicator signs here suggest that price action is mostly bearish.
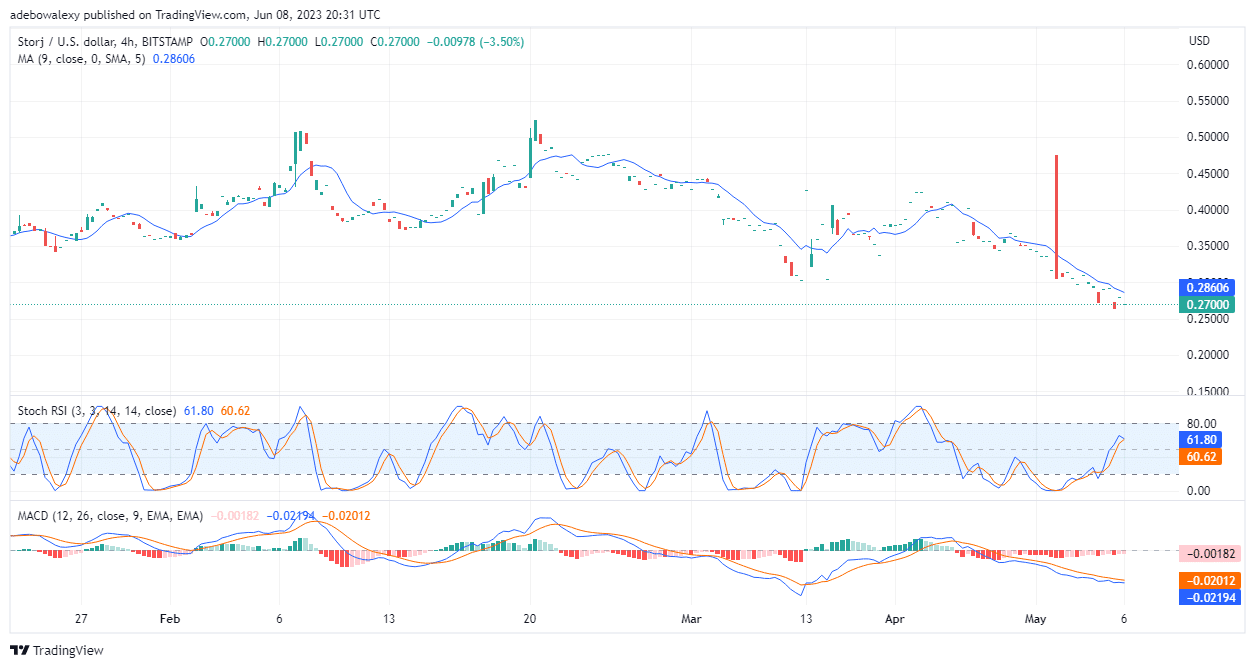
STORJ/USD Stays Consistent With Bearish Traits
In the 4-hour STORJ market, it appears that price action, even on this front, is retaining bearish characteristics. Here, the latest price candle remains a green dashed-shaped one. And this reveals that the market lacks buyers in this ongoing session. Also, this price candlestick is still under the 9-day MA curve. Furthermore, the Moving Average Convergence Divergence (MACD) indicator lines are trending downwards under the equilibrium level. Nevertheless, it should be noted that the last price candle has caused the MACD lines to move closer to each other. Traders can acticipate price action to retrace below the $0.2700 price mark to around 0.2600 mark.
- Broker
- Min Deposit
- Score
- Visit Broker

- Award-winning Cryptocurrency trading platform
- $100 minimum deposit,
- FCA & Cysec regulated

- 20% welcome bonus of upto $10,000
- Minimum deposit $100
- Verify your account before the bonus is credited
- Fund Moneta Markets account with a minimum of $250
- Opt in using the form to claim your 50% deposit bonus
Learn to Trade
Never Miss A Trade Again

Signal Notification
Real-time signal notifications whenever a signal is opened, closes or Updated

Get Alerts
Immediate alerts to your email and mobile phone.

Entry Price Levels
Entry price level for every signal Just choose one of our Top Brokers in the list above to get all this free.