Don’t invest unless you’re prepared to lose all the money you invest. This is a high-risk investment and you are unlikely to be protected if something goes wrong. Take 2 minutes to learn more
Presently, price action in the Immutable X daily market is trying to pull back at the downward retracement that has begun in its market. The downtrend started after price action crossed below the 9-day Moving Average line. Let’s further examine this mark.
IMX Analysis Data
IMX Value Now: $0.6962
Immutable X Market Cap: $636M
Immutable X Moving Supply: 914,163,545.54
IMX Total Supply: 2,000,000,000 IMX
CoinMarketCap Ranking: 62
Major Price Levels:
Top: $0.6962, $0.7000, and $0.7050
Base: $0.6922, $0.6900, and $0.6860
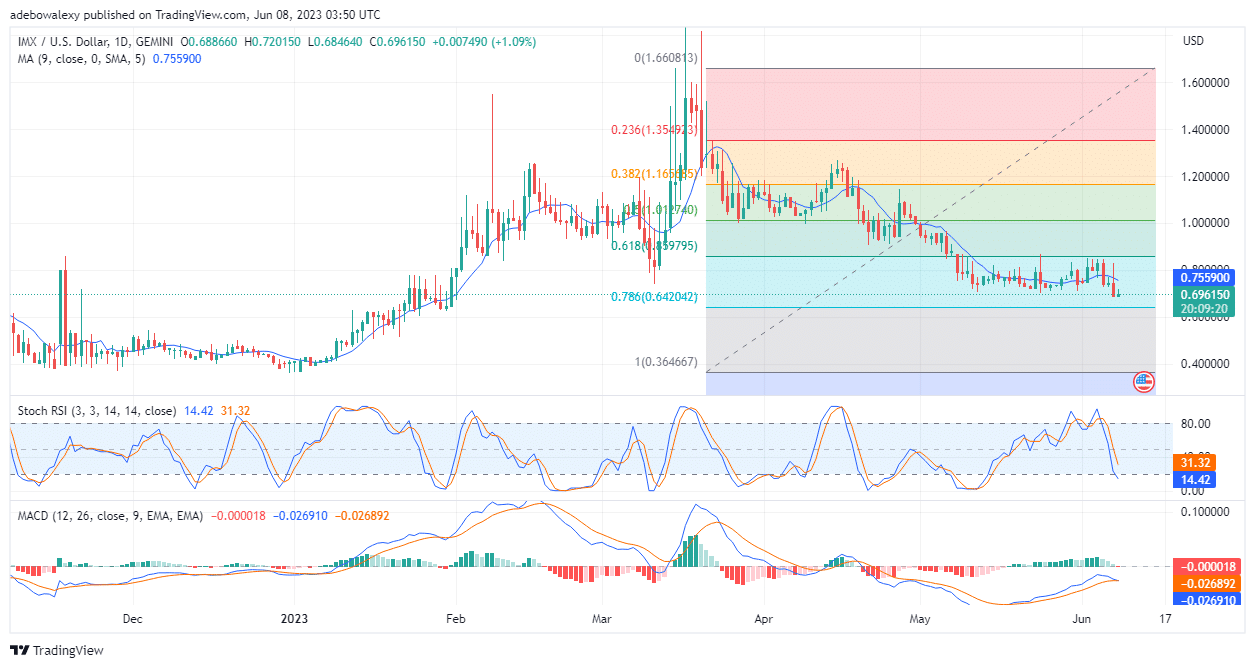
Immutable X Eyes Another Bull’s Line of Support
On the Immutable X daily market, prices have fallen below the 9-day Moving Average (MA) curve. Despite this, bulls aren’t backing down without a fight, as they’ve presented opposition to the downward retracement of price action via the last price candle on this chart. Nevertheless, trading indicators are still suggesting that the staged resistance by buyers seems weak at this point. The Relative Strength Index (RSI) indicator is advancing towards the oversold region without much disturbance, except for the slight curvature in its leading line. Additionally, the Moving Average Convergence Divergence (MACD) indicator also just displayed a bearish crossover. Consequently, this suggests that prices may extend toward lower support lines.
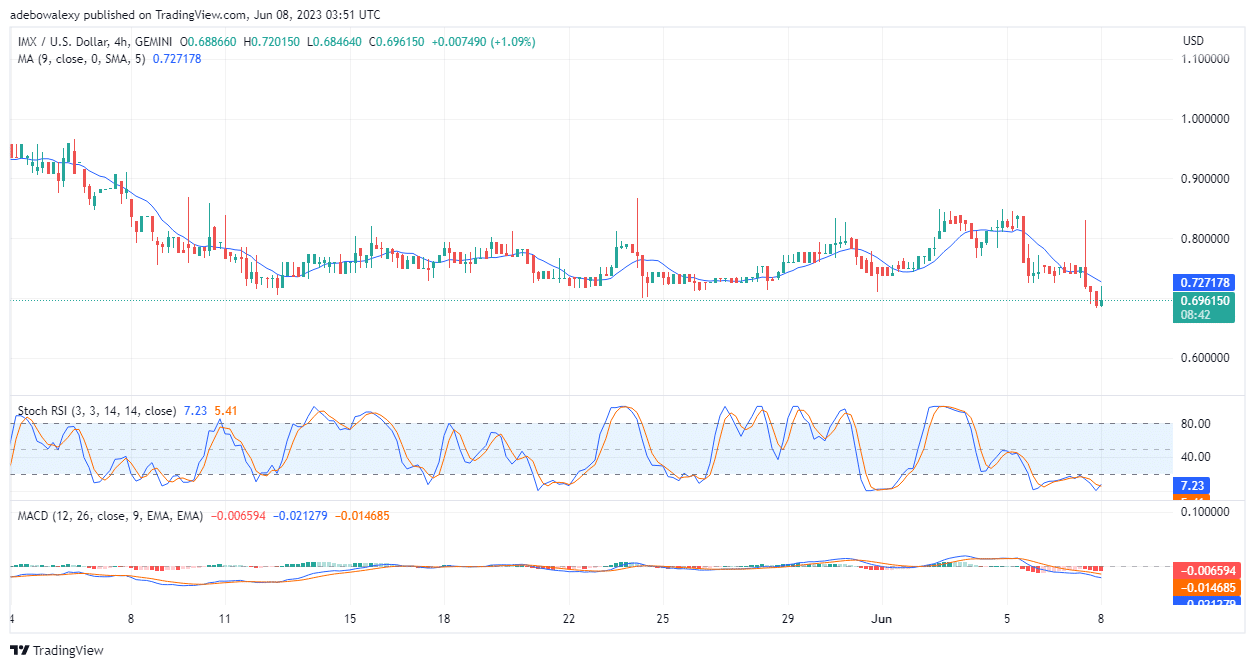
IMX Is Clinging to Hopes of Effectively Abating Headwind
One interesting fact about the IMX price action is its consistency with its hope of reversing the current market trend, from the daily chart to the 4-hour market. On this 4-hour chart, a green price candlestick can also be seen as the last price candlestick. This implies that upside potential has just started developing very recently. Additionally, price action now stands in the buyer’s region of the Fibonacci Retracement tool. In addition, an upside crossover can be perceived on the RSI indicator. But on the contrary, the MACD indicator hasn’t shown positive signs. However, the majority of indicators seem to point out that an upside retracement may be developing in this market, and traders can expect prices to retrace the $0.7200.
- Broker
- Min Deposit
- Score
- Visit Broker

- Award-winning Cryptocurrency trading platform
- $100 minimum deposit,
- FCA & Cysec regulated

- 20% welcome bonus of upto $10,000
- Minimum deposit $100
- Verify your account before the bonus is credited
- Fund Moneta Markets account with a minimum of $250
- Opt in using the form to claim your 50% deposit bonus
Learn to Trade
Never Miss A Trade Again

Signal Notification
Real-time signal notifications whenever a signal is opened, closes or Updated

Get Alerts
Immediate alerts to your email and mobile phone.

Entry Price Levels
Entry price level for every signal Just choose one of our Top Brokers in the list above to get all this free.