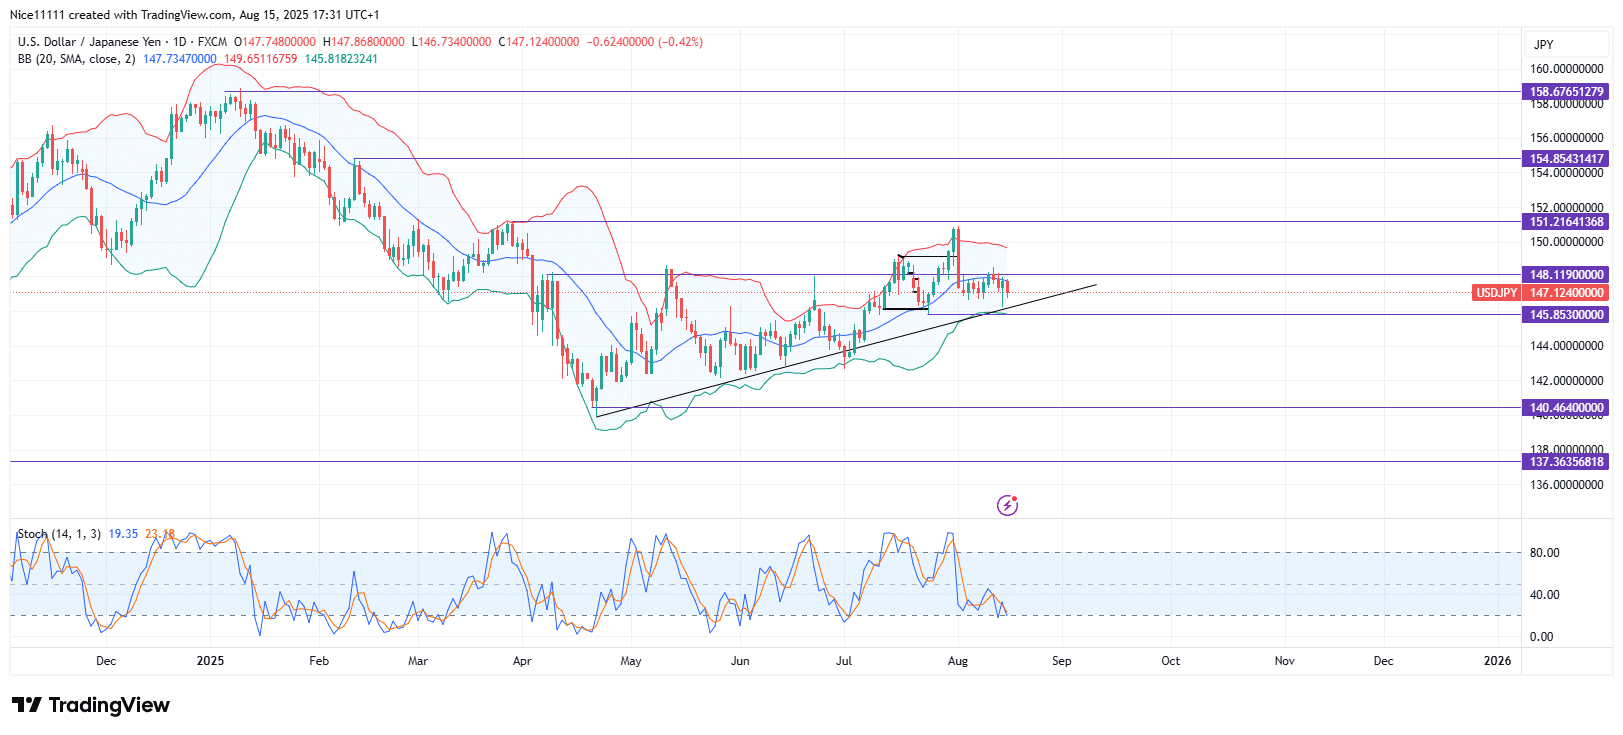
USDJPY – Guide, Tips & Insights | Learn 2 Trade – Guide, Tips & Insights | Learn 2 Trade finally broke the 148.110 resistance in July after forming successive bullish market structures. The price surged toward the swing high of 151.220, marked by strong bullish candles, but fell just short of reaching the 152.220 resistance level before undergoing a retracement.
During Q2, USDJPY – Guide, Tips & Insights | Learn 2 Trade – Guide, Tips & Insights | Learn 2 Trade repeatedly struggled to break above the 148.110 resistance. A double bottom pattern emerged at the start of July as the pair tested the lower Bollinger Bands, finding solid support. This sparked a sustained bullish rally that successfully breached the resistance in July.
Following the breakout, a healthy pullback provided a base for renewed upward momentum. The bullish drive quickly resumed, pushing price close to the swing high of 151.220—a region rich in liquidity. However, despite a series of large bullish candles, price stalled just shy of the level, forming a new swing high before retracing.
On the lower timeframes, USDJPY – Guide, Tips & Insights | Learn 2 Trade – Guide, Tips & Insights | Learn 2 Trade is currently ranging, with no significant structural shift visible on the higher timeframe. Buyers may attempt to rebound from the current range and mount another attack toward the 152.220 resistance.
Trade on MT4 with Leverage up to 1:500! Trade on MT4 with Leverage up to 1:500!
X
We use cookies to ensure that we give you the best experience on our website. If you continue to use this site we will assume that you are happy with it.

 USDJPY – Guide, Tips & Insights | Learn 2 Trade – Guide, Tips & Insights | Learn 2 Trade Short-term trend: Ranging


