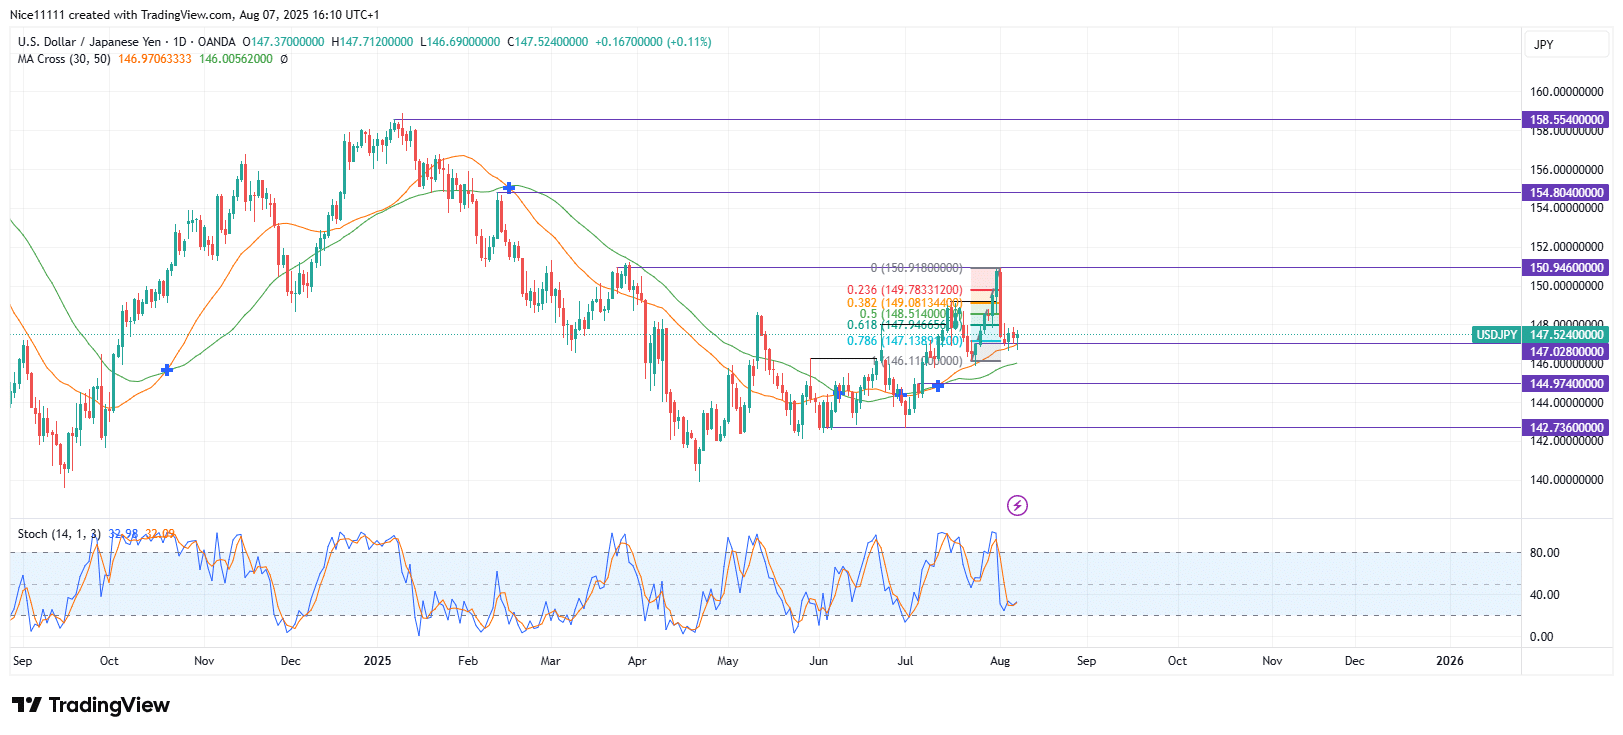
USDJPY – Guide, Tips & Insights | Learn 2 Trade – Guide, Tips & Insights | Learn 2 Trade has steadily climbed through a series of higher highs and higher lows, eventually reaching a notable resistance level at 150.950 on the daily chart. Recently, the price experienced a pullback, but this downward movement has not resulted in a structural shift. Currently, the market is trading in a discount zone, offering an optimal opportunity for bullish entries in alignment with the prevailing uptrend.
Throughout June, USDJPY – Guide, Tips & Insights | Learn 2 Trade – Guide, Tips & Insights | Learn 2 Trade remained stagnant, forming a cluster of equal lows near the 142.740 mark. During this period, the Moving Averages (periods 30 and 50) crossed twice, reflecting a phase of market indecision. However, a double bullish break of structure emerged in July, confirming the resumption of a bullish trend.
Subsequently, price action advanced to 150.950, aligning with a significant prior high. From there, the market has retraced towards the nearest swing low, yet no bearish structure shift has been established. The Fibonacci retracement tool currently marks a 78.6% level from the most recent bullish displacement, indicating a highly favorable entry zone for traders looking to rejoin the uptrend. Additionally, the price is reacting to a Moving Average, which is presently acting as dynamic support.
On the lower timeframes, the price is consolidating around the key level of 147.030. A confirmed bullish shift within this range would serve as an early signal for a potential reversal, reinforcing the larger bullish outlook. A double bottom pattern has formed on the lower timeframe. However, a decisive sweep of the 145.850 low would invalidate this scenario by triggering a bearish structure shift.
Trade on MT4 with Leverage up to 1:500! Trade on MT4 with Leverage up to 1:500!
X
We use cookies to ensure that we give you the best experience on our website. If you continue to use this site we will assume that you are happy with it.