Bears’ momentum may increase in USDCHF market
USDCHF Price Analysis – 16 April
In case sellers exert enough pressure, the $0.88 barrier level might be broken, and the falling trend might carry on to the $0.87 and $0.86 levels. The price may breach the $0.89 resistance level and rise toward the $0.90 and $0.91 resistance levels if buyers hold the $0.88 support level.
USDCHF Market
Key Levels:
Resistance levels: $0.89, $0.90, $0.91
Support levels: $0.88, $0.87, $0.86
USDCHF Long-term trend: Bearish
USDCHF is on a bearish movement on the Long-term outlook. A few weeks ago, sellers started dominating the market. The $0.93 resistance level was repelled by the price. For a few days, it moved in all directions. On March 9, a bearish engulfing candle formed, which caused the value to fall to test the $0.90 support level. As buyers and sellers battled for control of the aforementioned level, the price retested $0.93 on March 15; at this time, it has broken past the $0.90 and $0.89 levels and is confronting the $0.88 level.
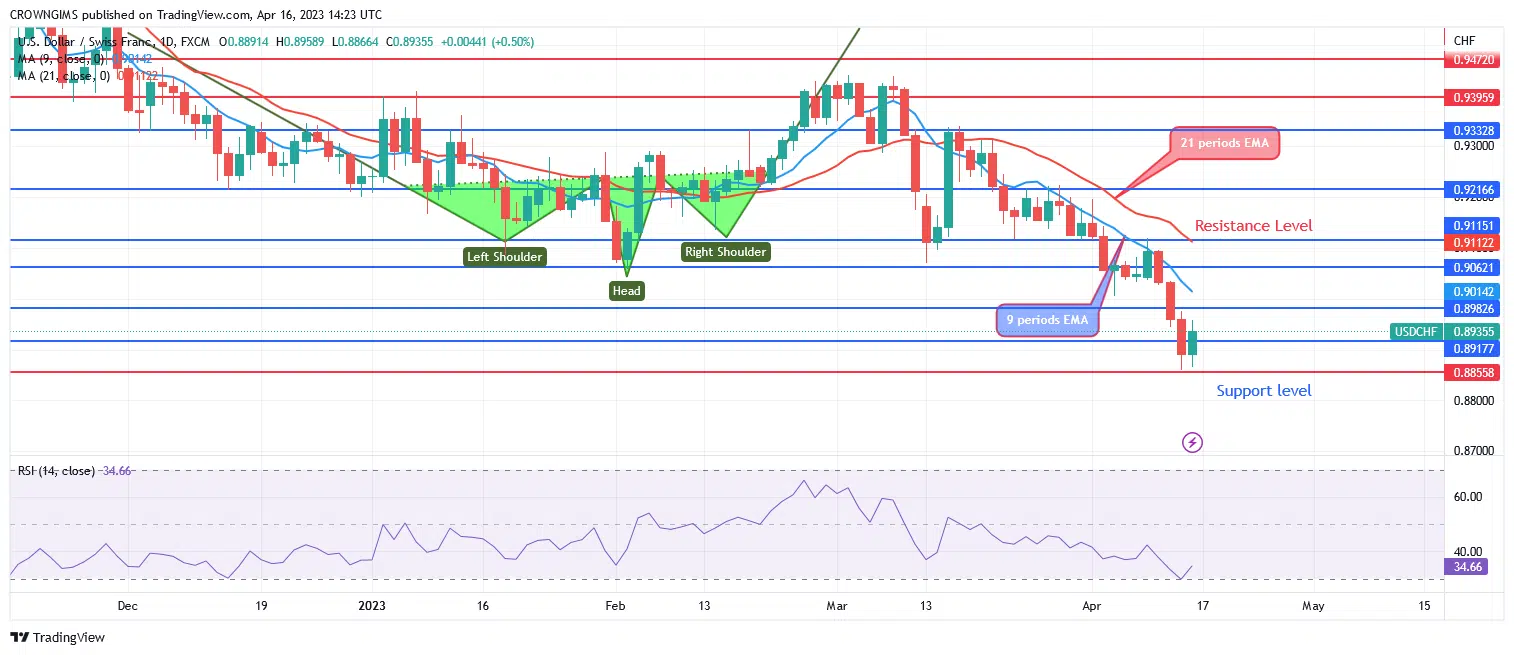
The 9-period EMA has crossed the downside of the 21-period EMAs, and USDCHF is currently trading below the two EMAs. A bearish market is indicated by the Relative Strength Index period 14 at 34 levels. In case sellers exert enough pressure, the $0.88 barrier level might be broken, and the falling trend might carry on to the $0.87 and $0.86 levels. The price may breach the $0.89 resistance level and rise toward the $0.90 and $0.91 resistance levels if buyers hold the $0.88 support level.
USDCHF Medium-term Trend: Bearish
USDCHF is bearish in the medium-term outlook. Upon reaching $0.93, a double top chart pattern emerged. It suggests a market that is gloomier. The trend for the currency pair shifts downward. In response to the sellers’ intervention, the price fell until it contacted the $0.90 support level. In the vicinity of the $0.93 resistance level, buyers tried to drive the price higher. The price decreased to the support level of $0.88 and it is challenging for buyers at the moment.
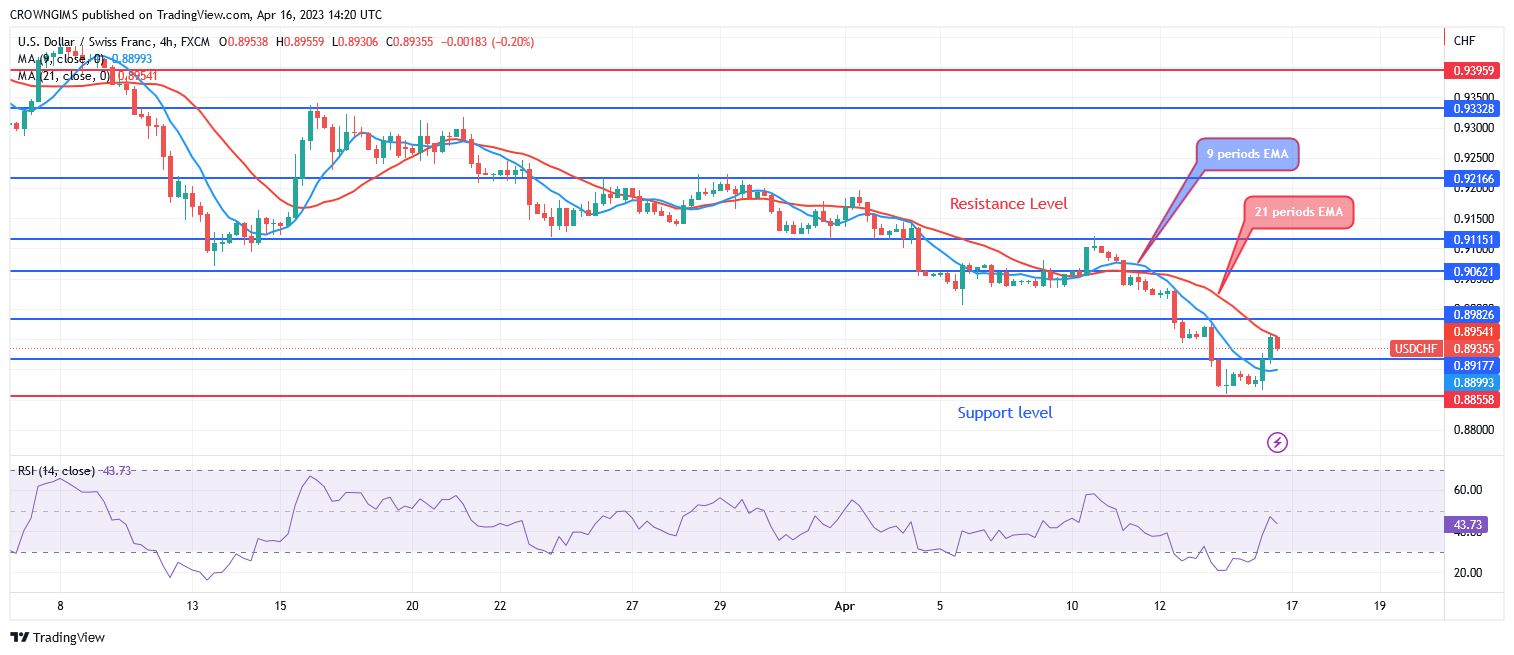
The 9-period EMA remains below the 21-period EMA. The USDCHF is currently trading between the two EMAs, indicating a bullish reversal or pullback market. The signal line on the Relative Strength Index period 14 is displaying a bullish direction at the 42 levels.
You can purchase Lucky Block – Guide, Tips & Insights | Learn 2 Trade here. Buy LBLOCK
- Broker
- Min Deposit
- Score
- Visit Broker

- Award-winning Cryptocurrency trading platform
- $100 minimum deposit,
- FCA & Cysec regulated

- 20% welcome bonus of upto $10,000
- Minimum deposit $100
- Verify your account before the bonus is credited
- Fund Moneta Markets account with a minimum of $250
- Opt in using the form to claim your 50% deposit bonus
Learn to Trade
Never Miss A Trade Again

Signal Notification
Real-time signal notifications whenever a signal is opened, closes or Updated

Get Alerts
Immediate alerts to your email and mobile phone.

Entry Price Levels
Entry price level for every signal Just choose one of our Top Brokers in the list above to get all this free.