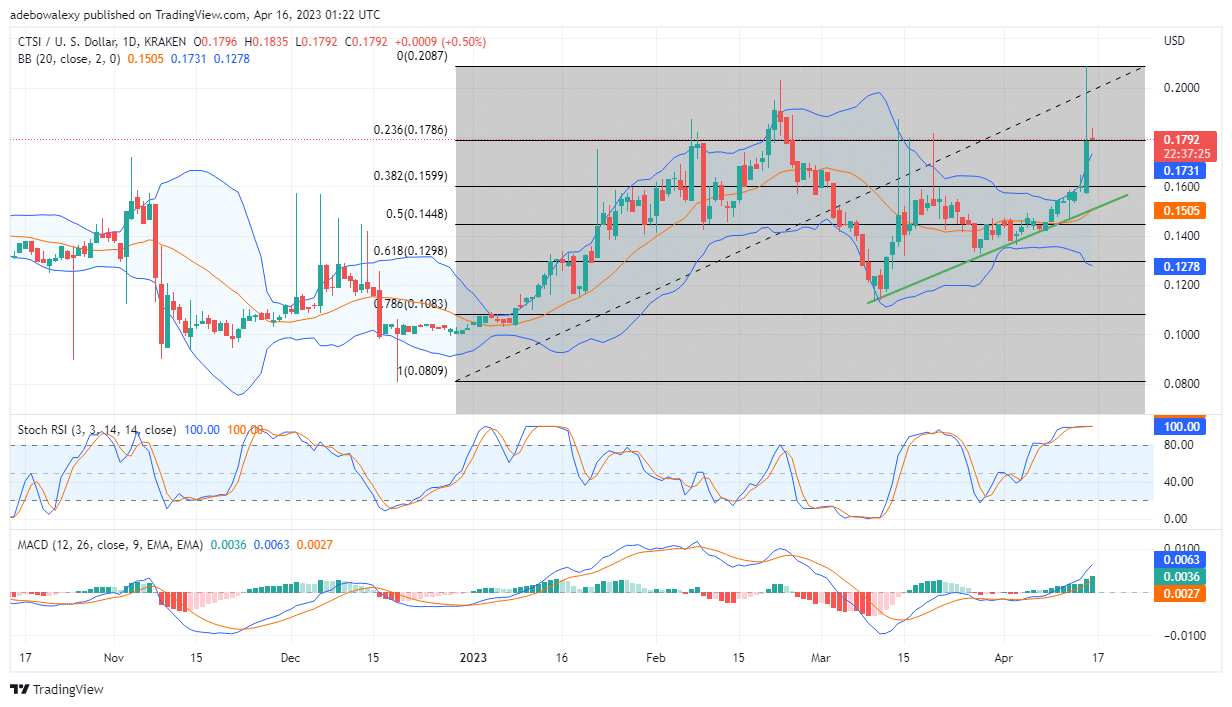
Cartesi Price action has been rising since about eight trading sessions ago. Nevertheless, in the previous session, price action had a massive jump in the upside direction. For now, it appears that we may witness more price increases.
Cartesi Analysis Data
CTSI value now: $0.1792
CTSI Protocol Market Cap: $128,404,989
Cartesi Moving Supply: 698,547,724
Cartesi Total Supply: 1,000,000,000
CTSI CoinMarketCap ranking: 238
Major Price Levels:
Top: $0.1792, $0.1820, and $0.1870
Base: $0.1772, $0.1750, and $0.1730

Cartesi (CTSI) Minor Downward Retracement Looks Too Minimal to Cause a Downtrend
On the Cartesi daily chart, price movements had a huge upside move in one session during the previous session. Nevertheless, this seems to have triggered some headwinds, which seem to be in their infancy. The last price candle here is an inverted red hammer candlestick. Meanwhile, more upside in this market seems likely since price action stays above the upper limit of the Bollinger Bands. Consequently, the mentioned headwind seems inconsequential at this point. Also, the RSI indicator lines stay at the peak of the oversold region, while the Moving Average Convergence Divergence indicator line keeps rising upwards. Additionally, the bars of the MACD are suggesting a more upside-biased move in this market.

Cartesi (CTSI) Seems Ready to Retain Its Upside Bearing
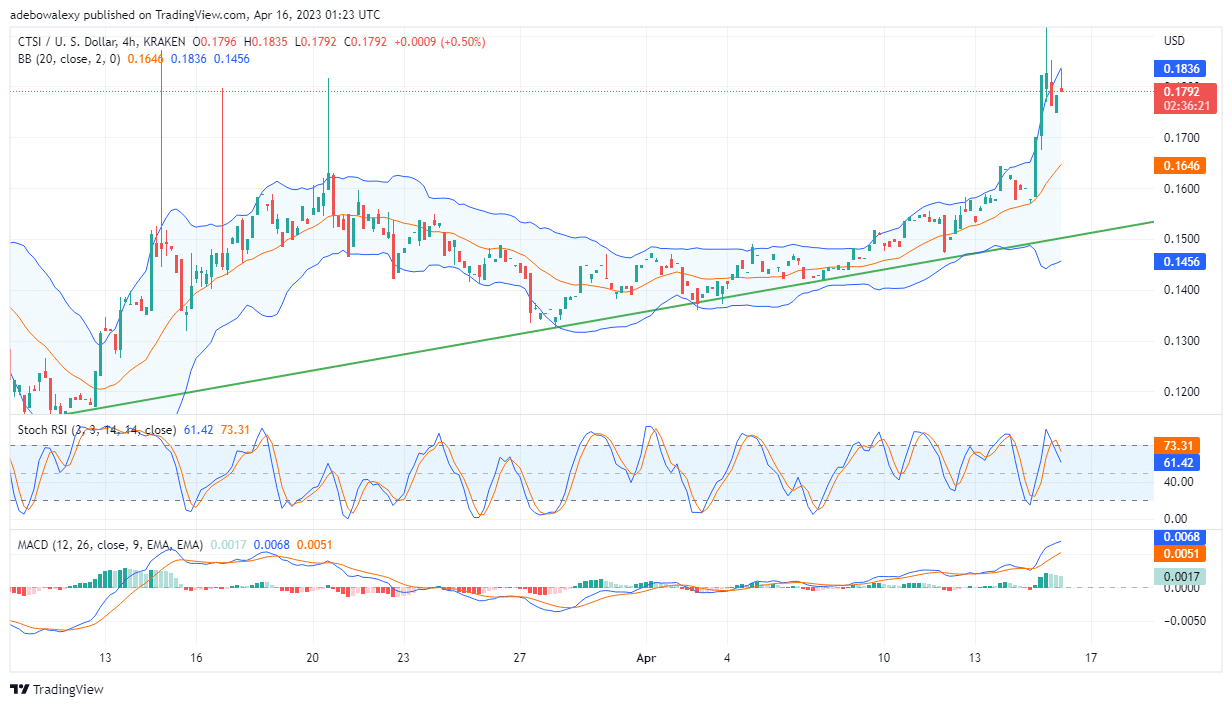
Considering a shorter CSTIUSD market chart, the effect of sellers seems to be more felt. In the past four trading sessions, the upside momentum in this market has slowed down. There was a downward retracement in the past three sessions, but the buyers soon took the price a bit higher. However, even the last bearish price candle here seems to be appearing higher than it should. Meanwhile, the RSI lines are trending downward following a crossover in the overbought zone. Also, the bars of the MACD are now green. But it appears that the curve of the MACD still has an upside bias, considering the distance between the two lines. Given these uncertainties, traders may want to wait to catch a price upside continuation move at the $0.1850 price mark.
- Broker
- Min Deposit
- Score
- Visit Broker
- Award-winning Cryptocurrency trading platform
- $100 minimum deposit,
- FCA & Cysec regulated
- 20% welcome bonus of upto $10,000
- Minimum deposit $100
- Verify your account before the bonus is credited
- Fund Moneta Markets account with a minimum of $250
- Opt in using the form to claim your 50% deposit bonus
Learn to Trade
Never Miss A Trade Again

Signal Notification
Real-time signal notifications whenever a signal is opened, closes or Updated

Get Alerts
Immediate alerts to your email and mobile phone.

Entry Price Levels
Entry price level for every signal Just choose one of our Top Brokers in the list above to get all this free.


