Market Analysis – April 12
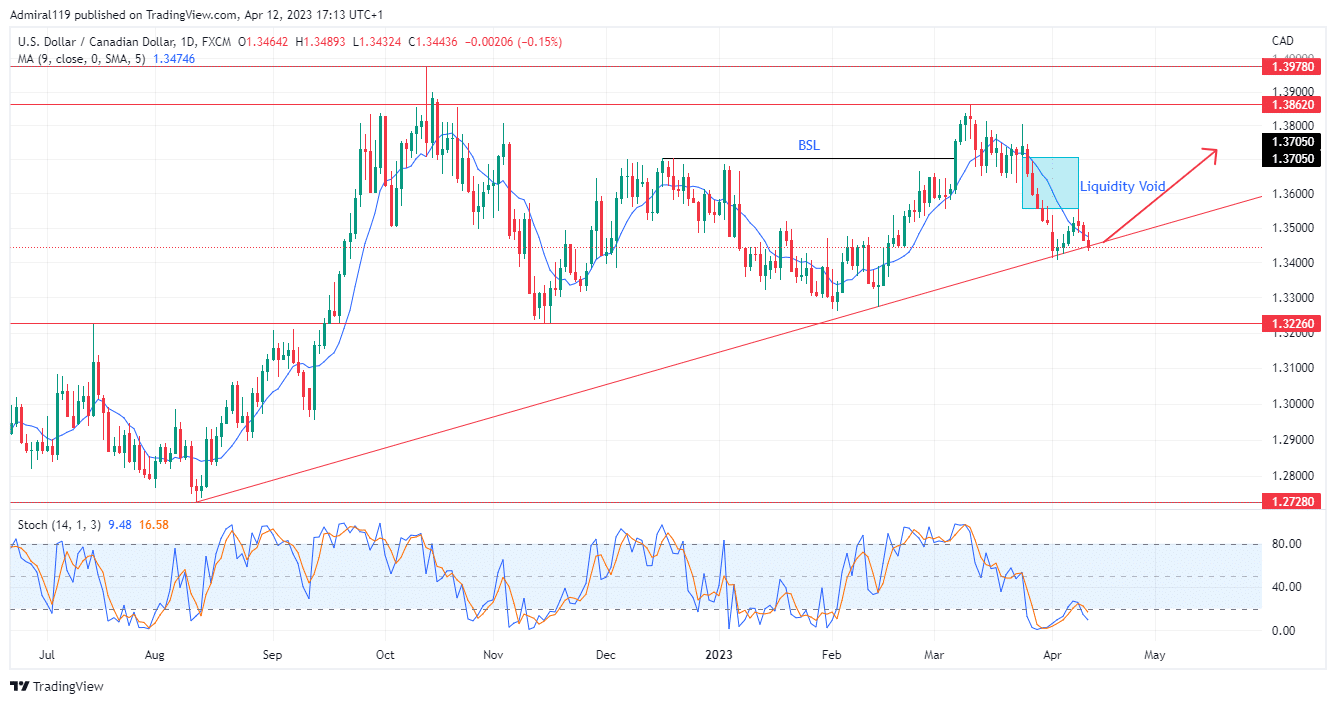
USDCAD sets to expand upward as price hits a rising trendline. On the daily chart, the market has been bullish since August 2022. The beginning of the upward trend also marked the beginning of the rising trendline. Price is likely to respect the rising trendline again as the Relative Strength Index (RSI) leaves the oversold region.
USDCAD Significant Zones
Demand Zones: 1.32260, 1.27280
Supply Zones: 1.38620, 1.39780

USDCAD Long-term Trend: Bullish
From the 1.27280 demand zone, the price rose aggressively after two consecutive highs. The first high after the bounce happened to break the last high before the bounce. As the price rallied aggressively, the intermediate low at the 1.32260 price level was invalidated. This brought more buyers into the market as more long orders were filled. However, the buying pressure eventually decreased as the Stochastic Oscillator showed that the market was extremely overbought. The upward trend closed after two consecutive higher highs.
The succeeding bearish trend came in as a result of the decreased buying pressure. The USDCAD sellers stormed the market after the 1.38620 supply zone was reached. But this decline was short-lived, as it only lasted from mid-October 2022 to mid-November 2022. USDCAD has been between the 1.38620 and 1.32260 price levels since the rebuff at the 1.39780 supply zone. Following the second bounce off the rising trendline, the 1.37050 high was invalidated, therefore implying an upward direction bias.


USDCAD Short-term Trend: Bearish
USDCAD is currently at its major rising trendline. The market is currently oversold on the four-hour chart according to the Stochastic Oscillator. Coupled with the buying pressure at the bullish order block, USDCAD is expected to resume the upward trend soon.
Do you want to take your trading to the next level? Join the best platform for that here
- Broker
- Min Deposit
- Score
- Visit Broker
- Award-winning Cryptocurrency trading platform
- $100 minimum deposit,
- FCA & Cysec regulated
9.8
- 20% welcome bonus of upto $10,000
- Minimum deposit $100
- Verify your account before the bonus is credited
9
- Fund Moneta Markets account with a minimum of $250
- Opt in using the form to claim your 50% deposit bonus
9
Learn to Trade
Never Miss A Trade Again

step 1
Signal Notification
Real-time signal notifications whenever a signal is opened, closes or Updated

step 2
Get Alerts
Immediate alerts to your email and mobile phone.

step 3
Entry Price Levels
Entry price level for every signal Just choose one of our Top Brokers in the list above to get all this free.


