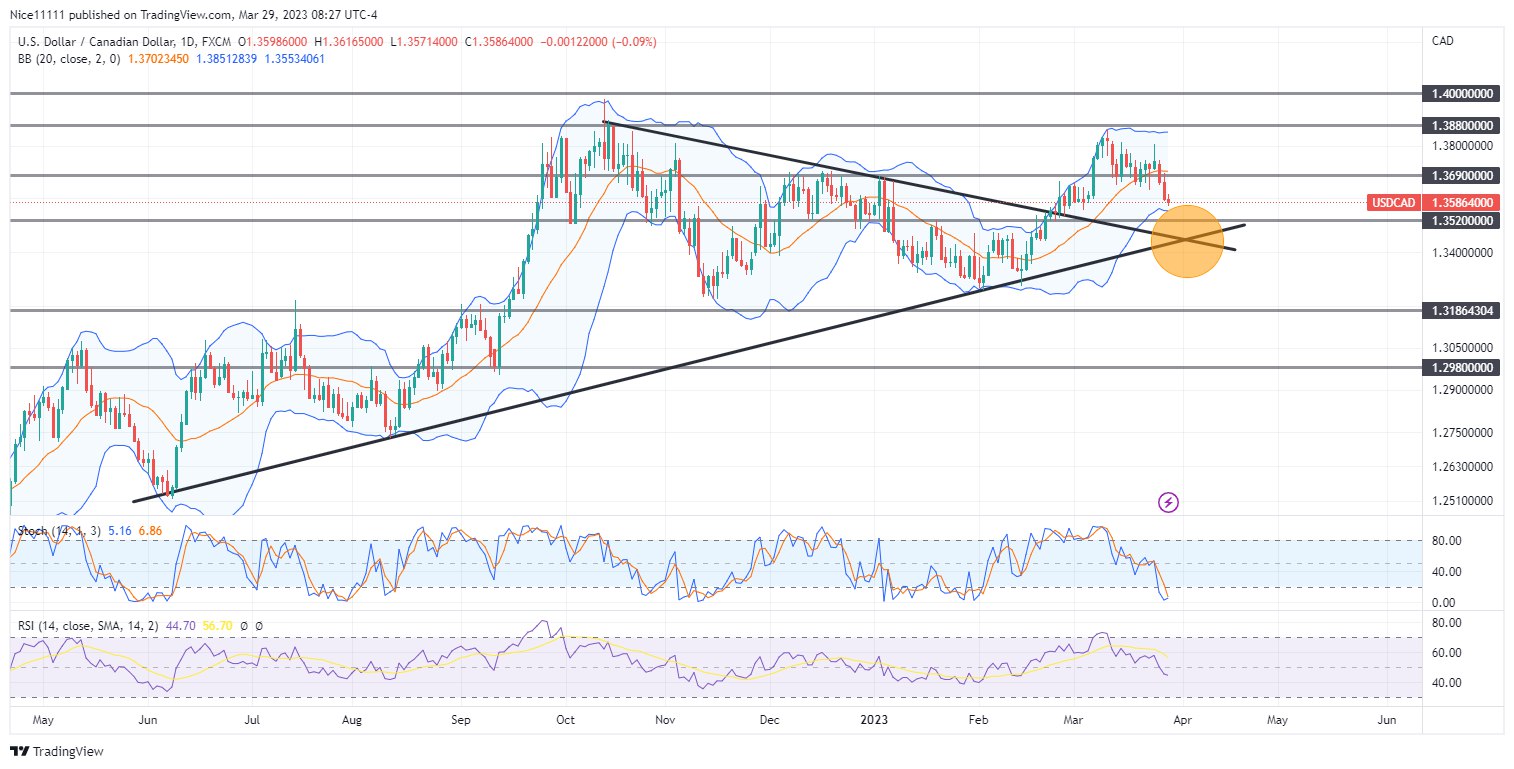
USDCAD saw a surge in price as it experienced a bullish breakout on the daily chart. Currently, the market is retracing towards a bullish confluence region situated below 1.3520. This region is significant as it is where the support and resistance trendlines cross and this could potentially lead to a reversal in the current trend.
In the long-term, the trend for USDCAD is bullish, as the market turned bullish after finding support in February, bouncing off the ascending trendline. This was confirmed when Stochastic revealed the market was oversold, and the market rose above the midline of the Bollinger Bands. However, since the test of the resistance level of 1.3880, the ascent has paused.
A significant development in the USDCAD chart is the breaking of the descending trendline that guided the descent from the supply zone of 1.3880 in October to the demand zone of 1.3200 in February. This break could indicate a potential shift in the trend, and the market is currently diving toward the oversold region at the crossroads of the support and resistance trendlines.
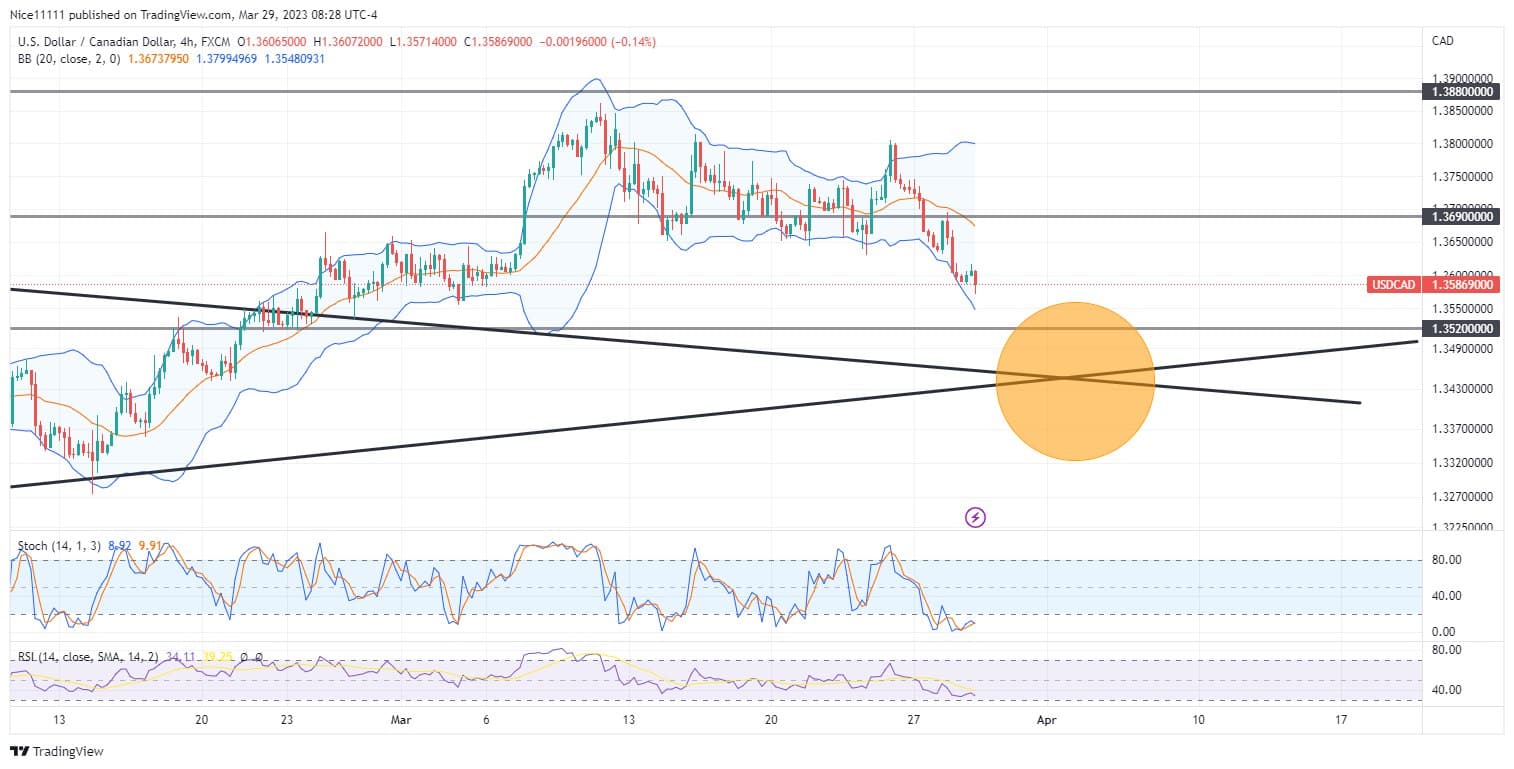
USDCAD Short-term Trend: Bearish
In the short term, the trend for USDCAD is bearish, as indicated by the stochastic on the four-hour chart. The market is currently oversold on both higher and lower timeframes, and a bullish convergence is expected to prompt a reversal to aim for 1.3880. However, as the market is currently in a retracement towards a significant confluence region, and a break below this region could lead to further bearish momentum.
Trade on MT4 with Leverage up to 1:500! Trade on MT4 with Leverage up to 1:500!
X
We use cookies to ensure that we give you the best experience on our website. If you continue to use this site we will assume that you are happy with it.