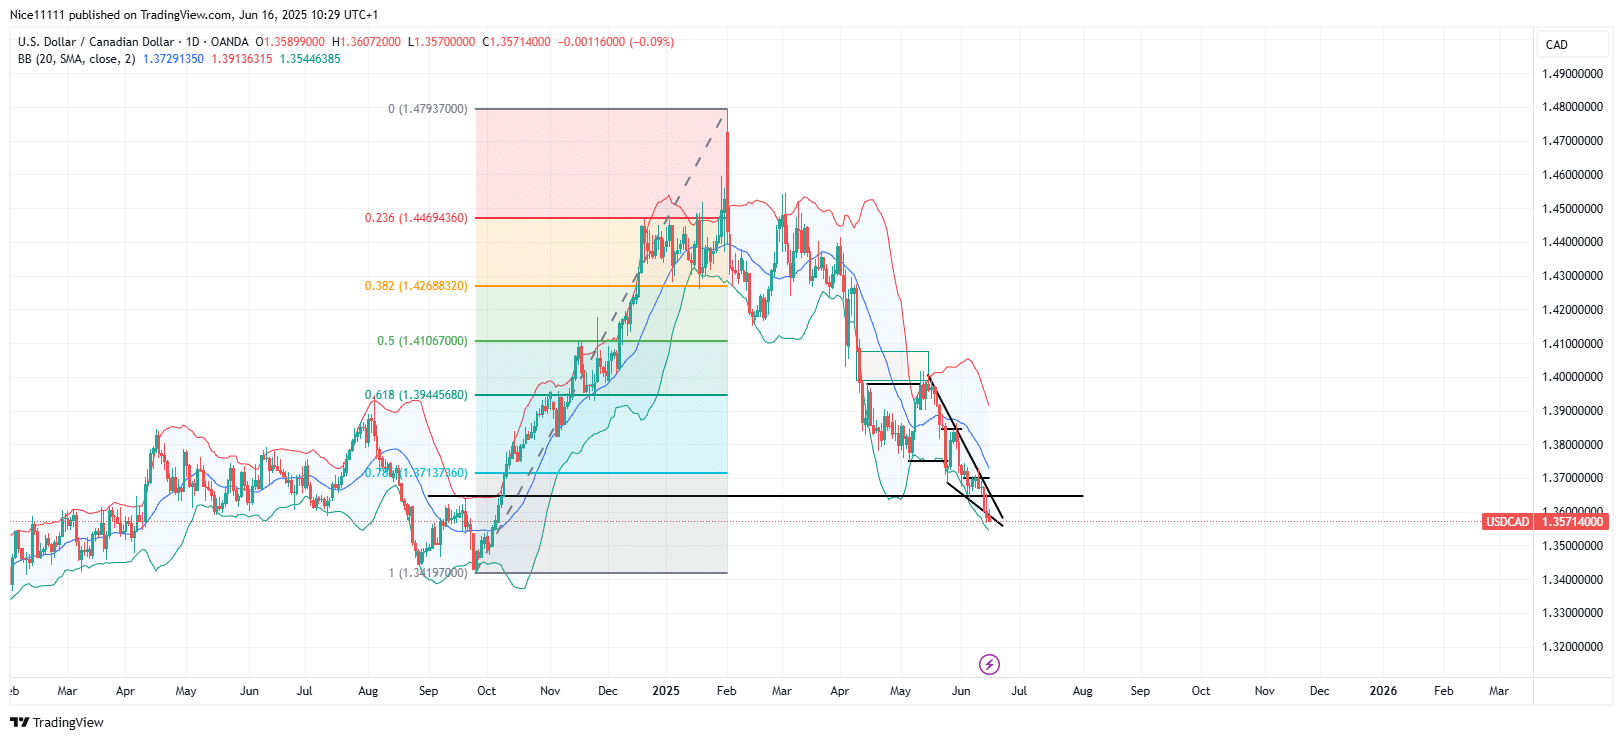
USDCAD continues to extend its bearish trajectory, maintaining a decisive downward market structure. The ongoing price descent is now approaching the lows established during the last bullish trend—areas typically known to hold significant resting orders and liquidity.
USDCAD Key Levels
Demand Levels: 1.3400, 1.3850, 1.4000
Supply Levels: 1.4000, 1.4300, 1.4600
USDCAD Long-Term Trend: Bearish
Between December and April, USDCAD exhibited prolonged consolidation around the 1.3000 region as market participants struggled to establish directional clarity. Eventually, sellers gained control, leading to a bearish shift in market structure.
.
This bearish development has unfolded through alternating impulsive and corrective phases. The corrections, comprised of mild bullish movements and sideways consolidations, are noticeably weaker and slower compared to the sharp downward impulses, reinforcing bearish momentum on the daily timeframe.
USDCAD Short-Term Trend: Bearish
The recent price action shows minimal reaction to the swing high around 1.3650, located in the buy-side liquidity zone. Instead, the pair retraced toward the upper Bollinger Band, which has provided dynamic resistance and fueled further short positioning.
.
Given the presence of relatively equal lows around the 1.3400 area, this level appears to be a key liquidity target. As such, sell-side delivery may persist toward this demand zone, with Forex signals likely anticipating further declines into this region.
Trade on MT4 with Leverage up to 1:500! Trade on MT4 with Leverage up to 1:500!
X
We use cookies to ensure that we give you the best experience on our website. If you continue to use this site we will assume that you are happy with it.

 USDCAD Short-Term Trend: Bearish
 USDCAD Short-Term Trend: Bearish


