

The Aave token has been on an upward trajectory since its price action rebounded off the support at the $120 level. As of today, the coin has recorded a price gain of 7.76%. This increase has allowed the market to gain notable leverage for the continuation of the bullish trend.
AAVE Statistics
Current Price: $291
Market Capitalization: $4.32B
Circulating Supply: 15.16M
Total Supply: 16M
CoinMarketCap Rank: 30
Key Price Levels
Resistance: $300, $350, $400
Support: $250, $200, $150
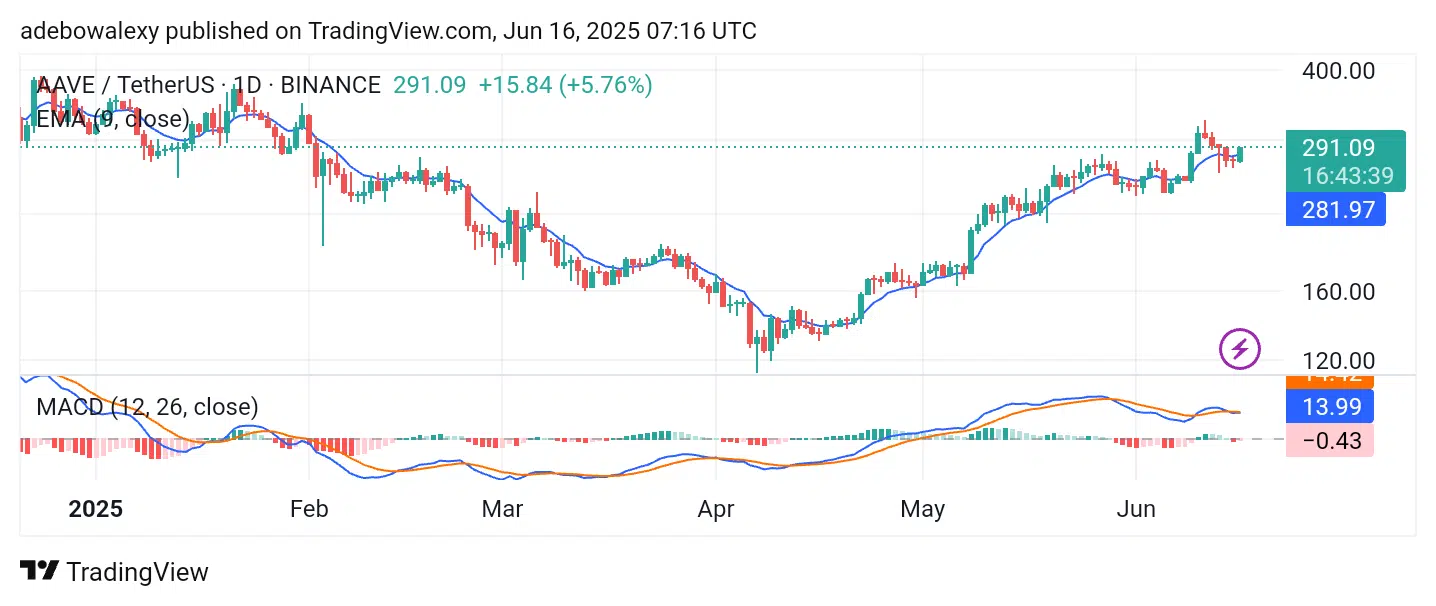
AAVE/USDT Breaks Through a Key Technical Level
Price activity on the Aave daily chart shows a rebound from the $120 support level on April 9. Since then, the market has remained on an upward path, with price action staying above the 9-day Exponential Moving Average (EMA) for most of the time.
The latest price candle has broken above the 9-day EMA line and remains green, signaling ongoing bullish pressure. The Moving Average Convergence Divergence (MACD) lines are positioned above the equilibrium level and appear to be converging toward a bullish crossover. This supports the outlook for further upward movement in the market.

Aave Bulls Maintain Momentum
Even on shorter timeframes, the AAVE/USDT 4-hour chart shows strong bullish behavior. The current session stands tall with no visible signs of bearish pressure. The corresponding price candle is green and remains above the 9-day EMA line.
Observing the characteristics of this candle, it’s evident that downward pressure is minimal. Meanwhile, the MACD indicator has recently delivered a bullish crossover below the equilibrium level, and the lines are now moving upward. Therefore, traders may set their sights on the $300 resistance level, and possibly even the $350 mark in the near term.
Make money without lifting your fingers: Start trading smarter today


