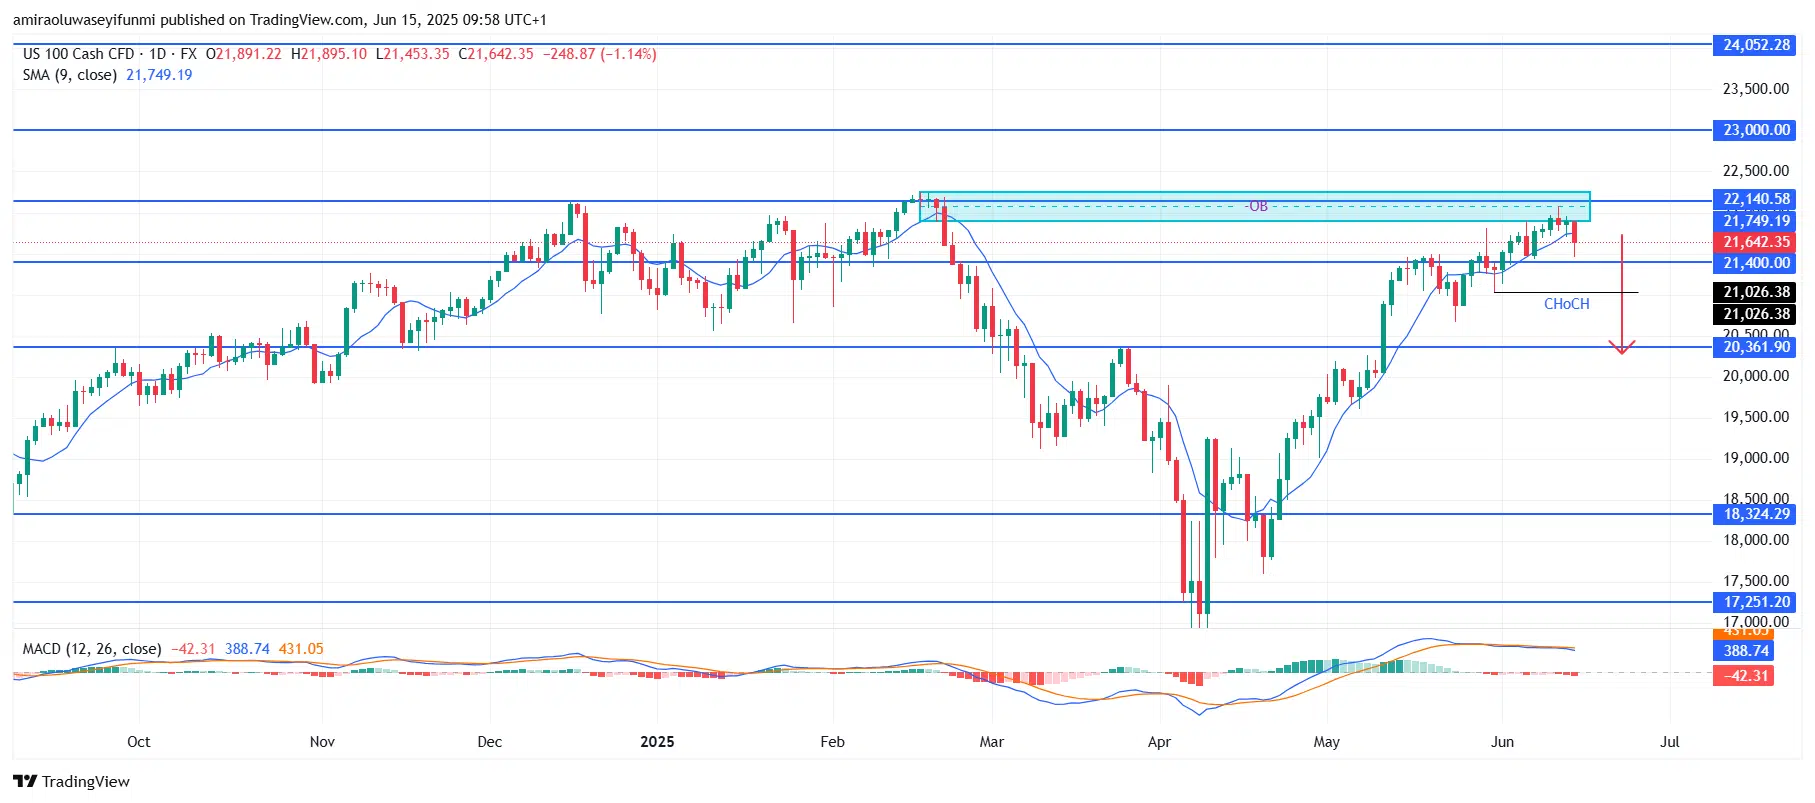
NAS100 has encountered strong rejection from the supply zone, signaling a potential reversal. After an extended bullish rally, the index is showing signs of deceleration, with momentum indicators pointing toward possible weakness. The MACD (Moving Average Convergence Divergence) histogram has formed consecutive lower highs, while the MACD line hovers close to the signal line, indicating that bullish momentum is fading. Additionally, price action has dropped below the 9-period SMA, currently around $21,750, which previously served as dynamic support. This shift suggests an early-stage bearish transition as buyers begin to lose their grip near a critical resistance area.
NAS100 Key Levels
Resistance Levels: $22,140, $23,000, $24,050 Support Levels: $21,400, $20,360, $18,320
NAS100 Long-Term Trend: Bearish
From a technical perspective, the index has reached a significant supply zone between $21,750 and $22,140—an area that triggered a steep selloff in March. A clear bearish rejection candle has formed off this zone, along with a market structure shift (CHoCH) just above the $21,030 level. This bearish development, paired with the overhead supply order block, points to distribution at the top and implies institutional profit-taking. The inability to maintain price above the psychological $22,000 mark further weakens bullish sentiment.
With the recent change in market structure and momentum, a retracement toward $20,360 appears more probable. If this support breaks, the next significant level lies near $18,320, with a deeper bearish target around $17,250. The critical resistance remains at $22,140, and any pullback into this zone that fails to make a higher high is likely to present a continuation sell opportunity. Overall, NAS100 appears set for a corrective phase after an extended uptrend, with sellers reclaiming control from fatigued buyers. Traders can also monitor forex signals for additional confirmation and trade opportunities during this transition.
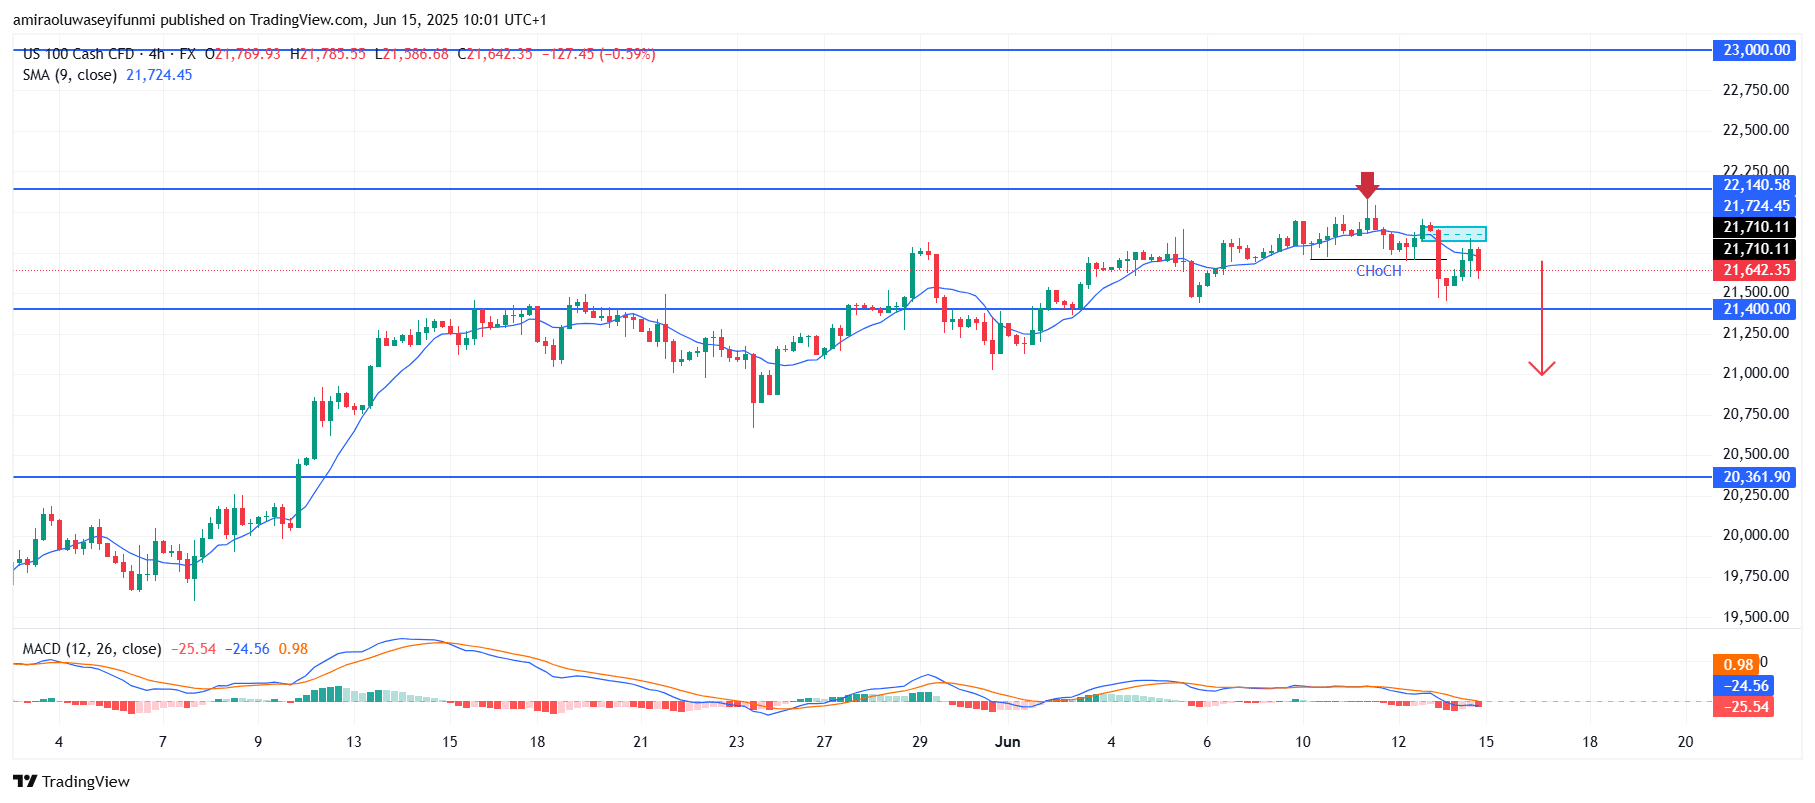
NAS100 Short-Term Trend: Bearish
On the 4-hour chart, NAS100 has confirmed a bearish shift following its rejection from the $22,140 supply zone and a break in market structure at $21,710. Price is now positioned below the 9-period SMA, indicating short-term bearish pressure.
Note: Learn2.trade is not a financial advisor. Do your research before investing your funds in any financial asset, product, or event. We are not responsible for your investment results.
Trade on MT4 with Leverage up to 1:500! Trade on MT4 with Leverage up to 1:500!
X
We use cookies to ensure that we give you the best experience on our website. If you continue to use this site we will assume that you are happy with it.