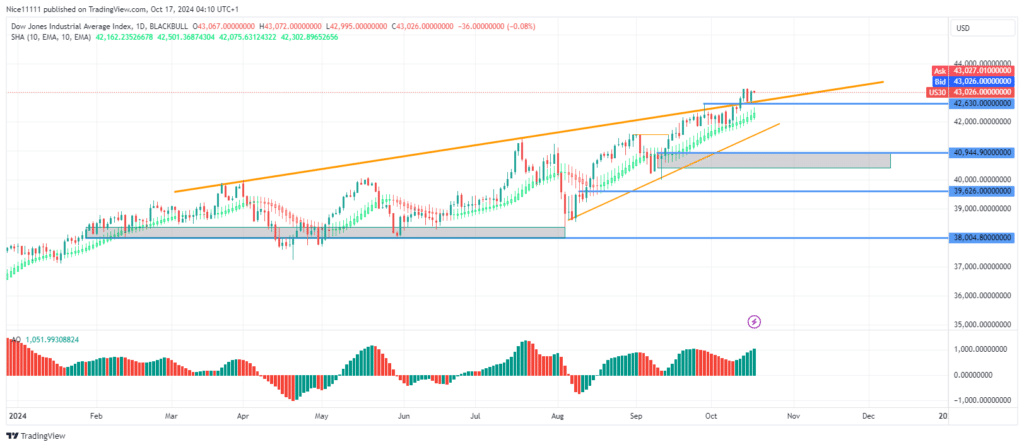
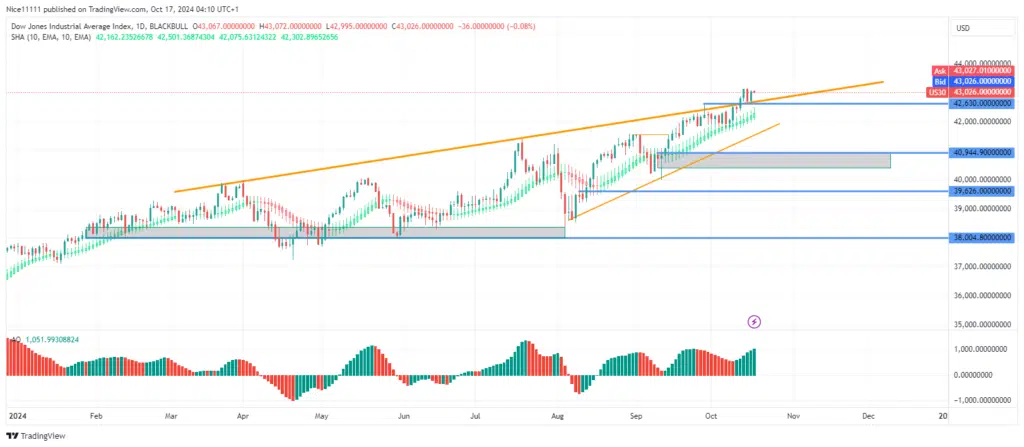
The US 30 index has broken above the upward-sloping resistance trendline on the daily chart. After this breakout, a retest of the trendline confirmed it as a support level, potentially propelling the index toward new highs.
A shooting star candle appeared on September 27 following the initial test of the resistance trendline on the daily chart, indicating a temporary pause in the uptrend. This trendline was based on previous swing highs. After the breakout, the US 30 price moved above the swing high formed by the shooting star, signaling a bullish break of structure.
In early September, the Smoothed Heikin Ashi candles effectively reduced the noise from the price retracement. The consistent green shades highlighted a sustained uptrend, despite the Awesome Oscillator showing red bars indicating a pullback.
US30 Short-term Trend: Bullish
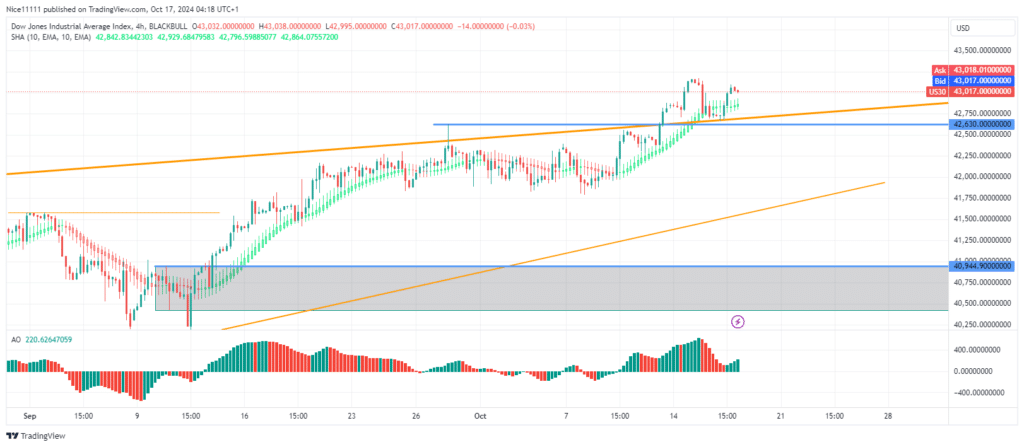
Following the breakout, a pullback tested the trendline, which has now become a support level for a potential rise. A move above the recent swing high of 43161.0 seems likely. Since the trendline test on the 4-hour chart, the Awesome Oscillator has shown increasing buying momentum, strengthening the bullish outlook. Traders looking for forex signals may find this an opportune setup to consider for the continuation of the uptrend.
Note: Learn2.trade is not a financial advisor. Do your research before investing your funds in any financial asset, product, or event. We are not responsible for your investment results.
Trade on MT4 with Leverage up to 1:500! Trade on MT4 with Leverage up to 1:500!
X
We use cookies to ensure that we give you the best experience on our website. If you continue to use this site we will assume that you are happy with it.