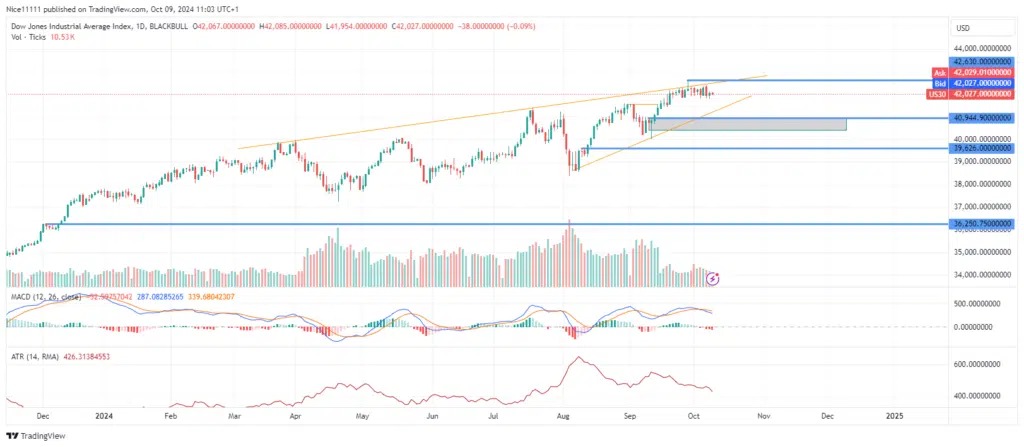
The US 30 market shows signs of a potential pullback within a rising wedge formation. The daily chart displays higher highs and lower highs with narrowing ranges, indicating the classic rising wedge pattern. This pattern suggests the possibility of a retracement as the price moves away from the resistance trendline.
The daily range of the US 30 index has contracted, with smaller daily candles indicating reduced volatility. The Average True Range (ATR) indicator confirms a decline since the recent swing low of 39,500.0. This trend is also supported by a steady decrease in volume, suggesting weakening buying momentum, which could lead to a retracement.
Positioned just below the current daily range is a strong bullish order block at 40,944.0, further supported by a fair value gap (FVG). This high-quality order block has the potential to trigger market volatility and attract significant buying volume, as indicated by forex signals.
US 30 Short-Term Trend: Bullish
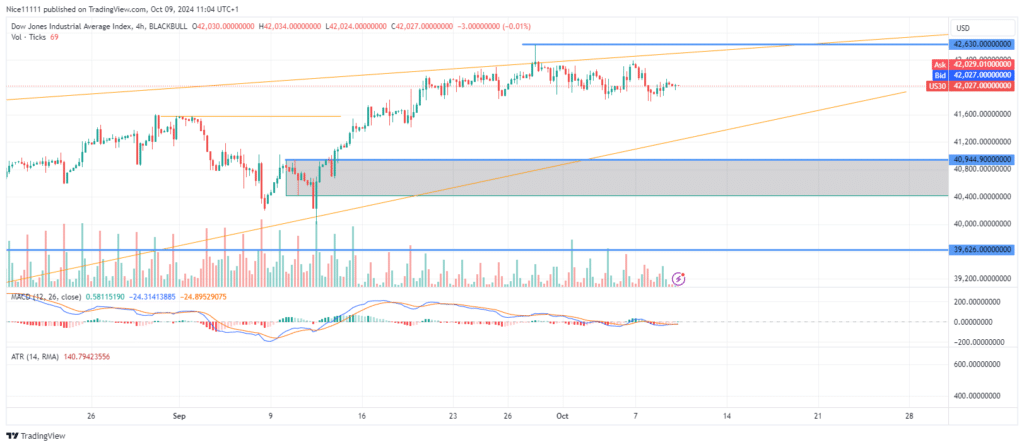
On the 4-hour timeframe, the market has entered a sideways range, indicating a pause in the upward movement. This sideways trend suggests a strong likelihood of a pullback toward the 40,944.0 level.
Note: Learn2.trade is not a financial advisor. Do your research before investing your funds in any financial asset, product, or event. We are not responsible for your investment results.
Trade on MT4 with Leverage up to 1:500! Trade on MT4 with Leverage up to 1:500!
X
We use cookies to ensure that we give you the best experience on our website. If you continue to use this site we will assume that you are happy with it.