STELLAR Price Analysis – June 15
Should the sellers push the price to penetrate the support level of $0.09 downside, price may decrease towards the support levels of $0.08 and $0.09. In case the daily candle close above the $0.11 resistance level by the bulls’ pressure, Stellar price may incline to $0.16 levels and may extend to $0.20.
XLM/USD Market
Key Levels:
Resistance levels: $0.11, $0.16, $0.20
Support levels: $0.09, $0.08, $0.07
XLM/USD Long-term Trend: Bearish
On the daily chart, Stellar is on the bearish movement. The bulls’ momentum was weak and the Bears’ pressure was low last week. The crypto was not able to break up the resistance level of $0.16. There was a low volatility in the market. On 12 June, bears gained more pressure and the support level of $0.16 was broken downside and the price exposes to $0.09 support level.
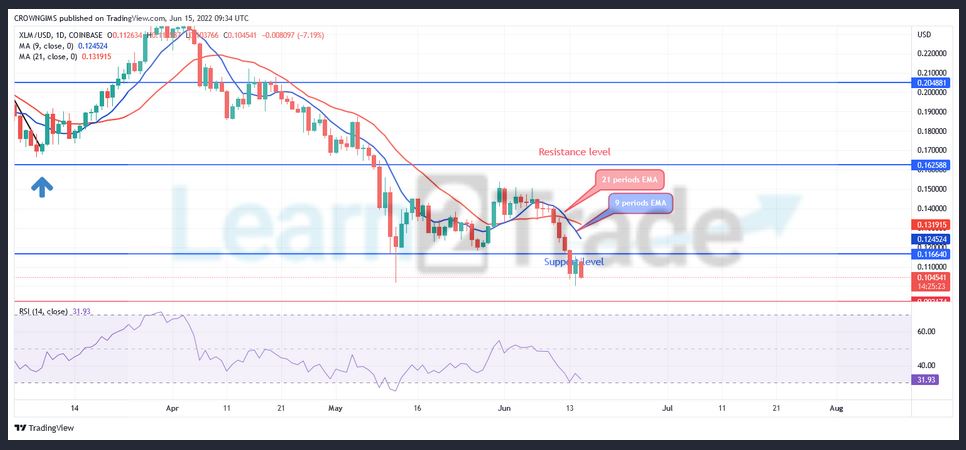
Stellar is trading below the 9 periods EMA and 21 periods EMA. The former has crossed the later downside. Should the sellers push the price to penetrate the support level of $0.09 downside, price may decrease towards the support levels of $0.08 and $0.09. In case the daily candle close above the $0.11 resistance level by the bulls’ pressure, Stellar price may incline to $0.16 levels and may extend to $0.20.
XLM/USD Medium-term Trend: Bearish
Stellar is on the bearish movement in the 4-hour chart. The crypto was range-bound within $0.16 and $0.11 levels last week. The pressure from the sellers push down the price to penetrate the support level of $0.11. The price is aiming at the previous low at $0.09 level. There is tendency for price to retest the just mentioned level before it continue bullish trend.
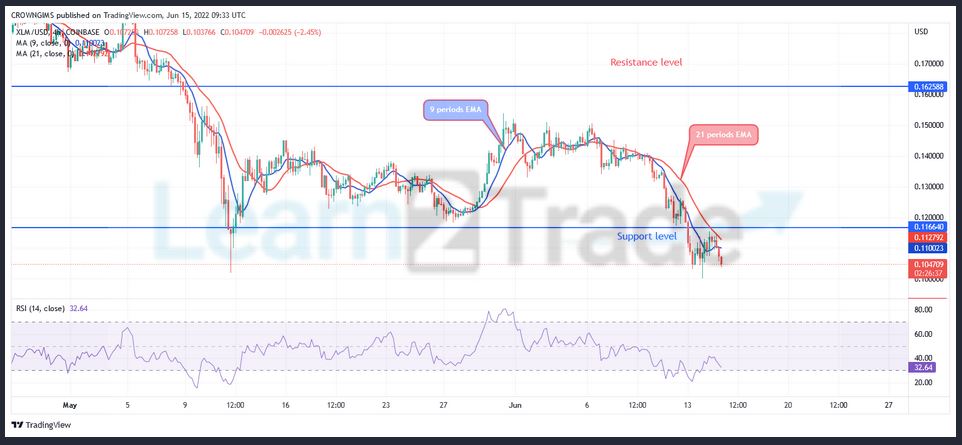
Stellar is trading below the 9 periods EMA and 21 periods EMA as a sign of bearish market. The Relative Strength Index periods 14 is at 32 levels and the signal line displaying bearish direction.
You can purchase Lucky Block – Guide, Tips & Insights | Learn 2 Trade here: Buy LBlock
- Broker
- Min Deposit
- Score
- Visit Broker

- Award-winning Cryptocurrency trading platform
- $100 minimum deposit,
- FCA & Cysec regulated

- 20% welcome bonus of upto $10,000
- Minimum deposit $100
- Verify your account before the bonus is credited
- Fund Moneta Markets account with a minimum of $250
- Opt in using the form to claim your 50% deposit bonus
Learn to Trade
Never Miss A Trade Again

Signal Notification
Real-time signal notifications whenever a signal is opened, closes or Updated

Get Alerts
Immediate alerts to your email and mobile phone.

Entry Price Levels
Entry price level for every signal Just choose one of our Top Brokers in the list above to get all this free.