

AUDUSD Price Analysis – June 15
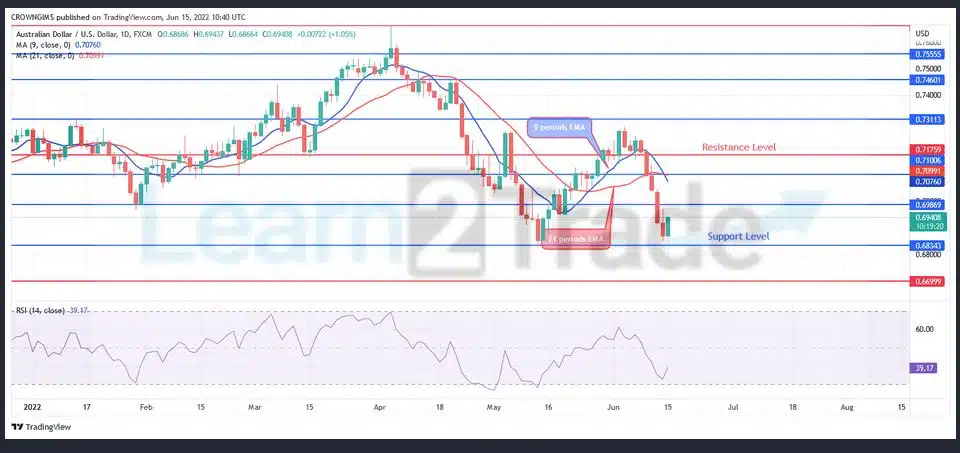
Ability to break down the support level of $0.69 level may lead to price decline towards the support level of $0.66 and $0.65. The closing of daily candle above $0.69 level by the bulls may push the price to test the resistance levels of $0.70 and $0.71.
AUD/USD Market
Key levels:
Resistance levels: $0.69, $0.70, $0.71
Support levels: $0.68 $0.66, $0.65
AUDUSD Long-term trend: Bearish
AUDUSD is bearish on the daily chart. The currency pair was bullish last week. The buyers’ momentum pushed the price to the resistance level of $0.73. The bulls’ momentum fails and the price consolidates for two days. On June 09, a daily bearish candle formed which indicate an increase in the bears’ momentum. The price declines to the support level of $0.68. The mentioned level was tested on June 14. The price is trying to pull back at the moment.
AUDUSD medium-term Trend: Bearish
AUDUSD is bearish on the 4-hour chart. The bullish trend was rejected at the resistance level of $0.73 this made the price to consolidate within the support level of $0.71 and $0.73 levels. A bearish engulfing candle formed and the price decreases to test the support level of $0.68. The bearish momentum is failing as more bullish candles are producing.

AUDUSD is currently trading between the 9 periods EMA and 21 periods EMA. The relative strength index period 14 is at 40 levels and the signal lines pointing up to indicate a buy signal.
You can purchase Lucky Block here. Buy LBlock:


