Key Support Zones: $7, 000, $6, 000, $5,000
BTC/USD Long-term Trend: Ranging
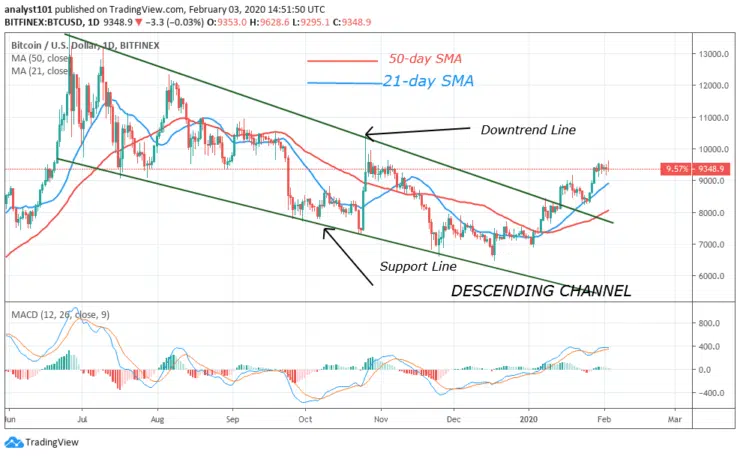
Bitcoin has continued its sideways trend for the past one week. The market is still ranging in a tight range between $9,200 and $9,600. In retrospect, in October 2019, Bitcoin was also in a sideways trend at the same price level. The coin was in a sideways trend between October 26 and November 6. The pair fluctuated for two weeks and had a price breakdown.
The coin nosedived to a low of $7,000, in line with the prevailing trend. Today, BTC is in an upward move, a breakout will push Bitcoin to the high of $10,300. On the other hand, a breakdown will catapult the coin to a low of $8,800 or $7,800. Nonetheless, the advantage is on the side of the bulls because of the prevailing trend.
Daily Chart Indicators Reading:
Meanwhile, the MACD line and the signal line are above the zero line which gives the coin a buy signal. Similarly, the 21-day SMA is still above the 50-day SMA indicating the rise of the coin. Besides, EMAs are trending upward indicating the uptrend.
BTC/USD Medium-term Trend: Bullish
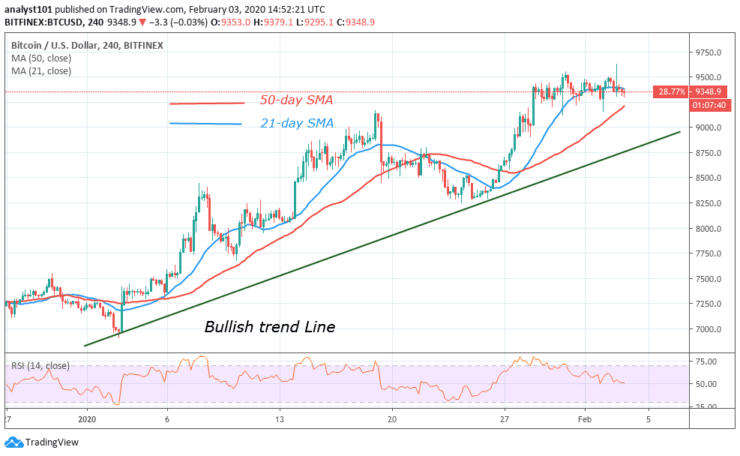
On the 4-hour chart, BTC is in an uptrend. The price tested the bullish trend line on two occasions and rebounded. The support level on the trend line is where the coin bounces to the previous highs. Meanwhile, the upward move is stuck at the $9,500 resistance. Small body candlesticks are consolidating below the resistance level.
4-hour Chart Indicators Reading
As Bitcoin is falling, the Relative Strength Index (RSI) period 14 is also falling. The RSI has fallen to level 49 indicating that Bitcoin is in the downtrend zone. The price has broken below the 21-day SMA and if it extends to the 50-day SMA, selling pressure may resume.
General Outlook for Bitcoin (BTC)
The pair is likely to continue its range bound movement for a few more days. At the moment, the coin is falling to the lower price range. A long trade should be initiated at a low of $9,200 if the support holds. At the low of $9,200, the price is likely to go up to retest the $9,600 resistance
BTC Trade Signal
Instrument: BTC/USD
Order: Buy
Entry price: $9,343
Stop: $9,000
Target: $10,300
Note: Learn2Trade.com is not a financial advisor. Do your research before investing your funds in any financial asset or presented product or event. We are not responsible for your investing results
- Broker
- Min Deposit
- Score
- Visit Broker

- Award-winning Cryptocurrency trading platform
- $100 minimum deposit,
- FCA & Cysec regulated

- 20% welcome bonus of upto $10,000
- Minimum deposit $100
- Verify your account before the bonus is credited
- Fund Moneta Markets account with a minimum of $250
- Opt in using the form to claim your 50% deposit bonus
Learn to Trade
Never Miss A Trade Again

Signal Notification
Real-time signal notifications whenever a signal is opened, closes or Updated

Get Alerts
Immediate alerts to your email and mobile phone.

Entry Price Levels
Entry price level for every signal Just choose one of our Top Brokers in the list above to get all this free.