

While the Platinum market had earlier in the week resurfaced above the $1,400 threshold, it has since faced a sharp downward rejection. This appears to have been triggered by short-term traders taking profits at the spike. The CFTC Disaggregated Commitment data revealed this activity.
Key Price Levels
Resistance: $1,400, $1,500, $1,600
Support: $1,300, $1,200, $1,100
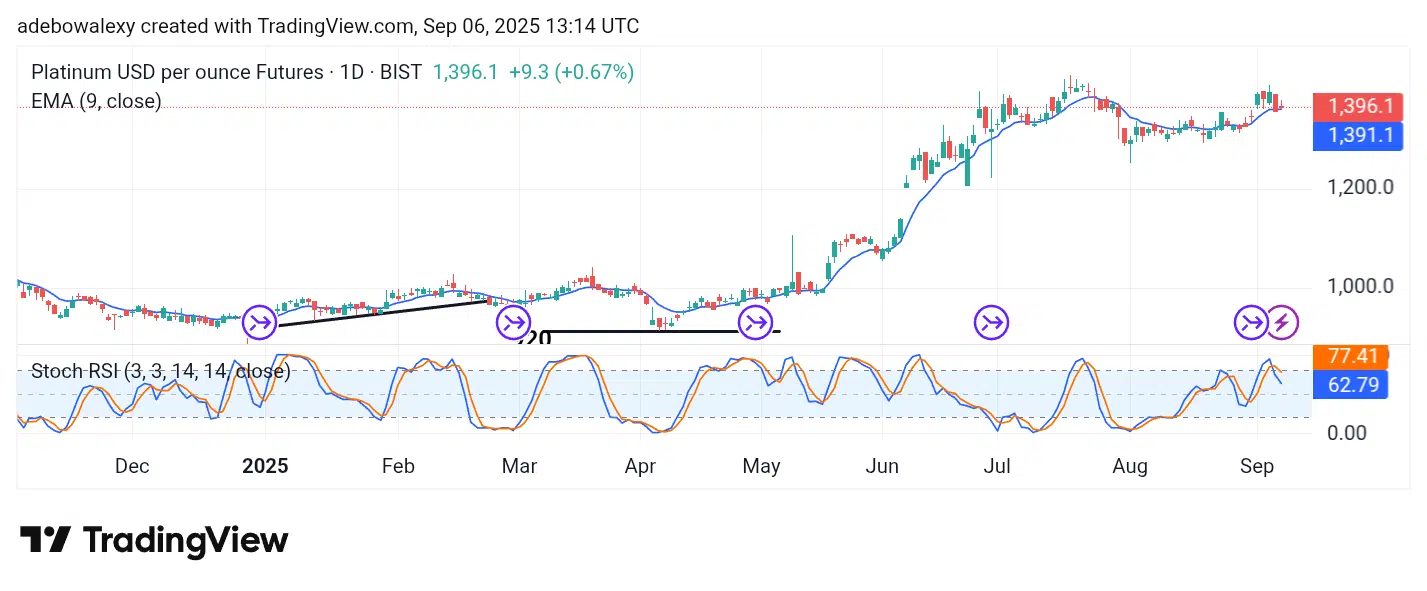
Platinum Maintains Support Above $1,390
Price action in the XPT daily chart seems to have reached a near-term bottom, suggesting that short-selling traders may be losing momentum. The last price candle on the chart appears as an inverted red candle, positioned just above the 9-day Exponential Moving Average (EMA).
A closer look at the candle shows that it holds a higher base compared to the previous session. Meanwhile, the Stochastic Relative Strength Index (SRSI) indicator lines continue to decline toward the 50 level, hinting at ongoing weakness.

XPT Resistance Appears Vulnerable
On shorter time frames, Platinum’s price action is positioned below the 9-day EMA line. However, the latest price candle suggests that bullish forces are attempting to provide resistance against further declines. Despite this, the market still trades beneath the 9-day EMA.
At the same time, the SRSI indicator lines remain in the oversold region, with both lines now merged and moving sideways. Technically, this setup implies that the market may head downward toward the $1,350 level. Even so, traders should monitor economic news releases that could drive the market back above the $1,400 mark and possibly toward the $1,450 level.
Make money without lifting your fingers: Start trading smarter today


