The Australia 200 market has tracked Wall Street’s movement and, as such, edged strongly higher for two sessions. However, the upside momentum seems to have snapped. Indications from this market still suggest that the uptrend may persist. Let’s take a closer look below.
Key Price Levels
Resistance: 9,000, 9,500, 10,000
Support: 8,500, 8,000, 7,500
Australia 200 Hits a Barrier
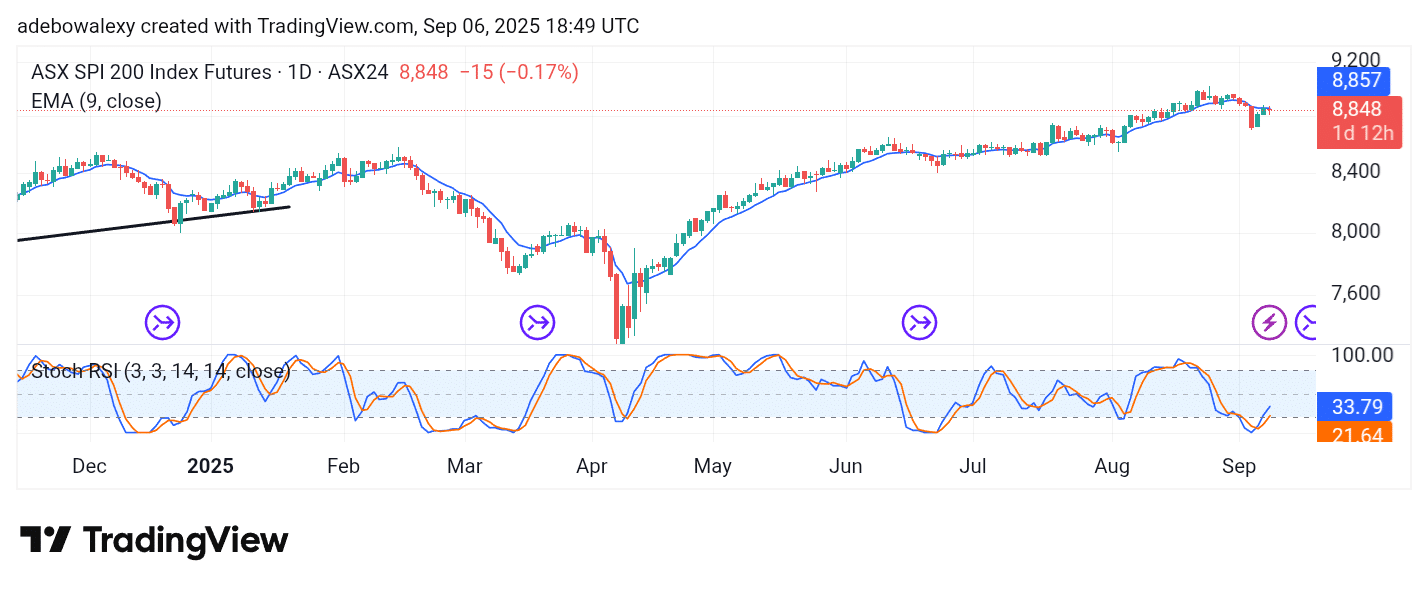
The ASX daily chart shows that price action has rebounded off the resistance at the 9-day Exponential Moving Average (EMA) line. This downward dip keeps price action below the 9-day EMA curve. However, the short-term upward retracement can still be considered intact since it is only a modest downward retracement.
Consequently, the lines of the Stochastic Relative Strength Index (SRSI) indicator are still pointing upward from the oversold region. This supports the view that upside forces are likely to sustain the short-term upward trend.
ASX 200 Bull Holds the Sway
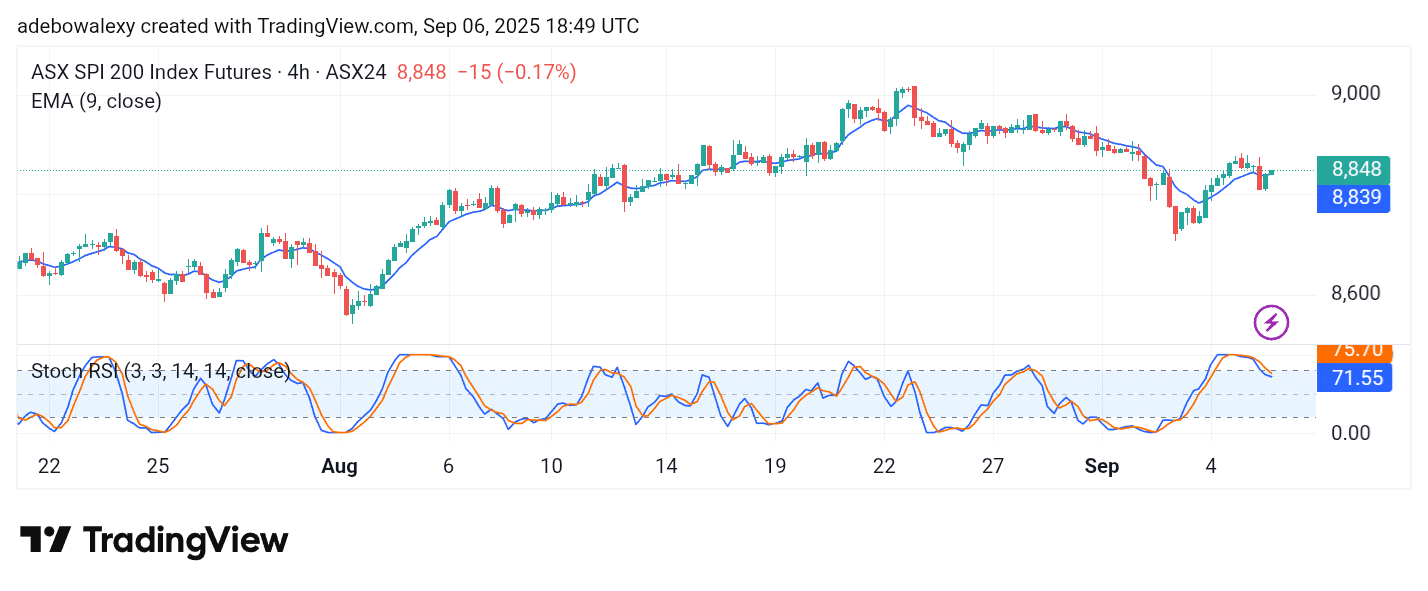
The Australia 200 4-hour chart reveals that upside forces are maintaining a favorable stance. Here, price action can be seen to have moved above the upper band of the Bollinger Bands (BB) indicator. The last price candle on the chart sits directly above the 9-day EMA curve.
Technically, this supports a continued upward retracement in this market as mentioned earlier. The SRSI lines can be seen falling toward the 70 mark of the indicator. However, the lead line of the indicator is tending toward a crossover. An eventual crossover will support a continued upward retracement. As such, this market may push through the 9,000 price level.
Trade on MT4 with Leverage up to 1:500! Trade on MT4 with Leverage up to 1:500!
X
We use cookies to ensure that we give you the best experience on our website. If you continue to use this site we will assume that you are happy with it.