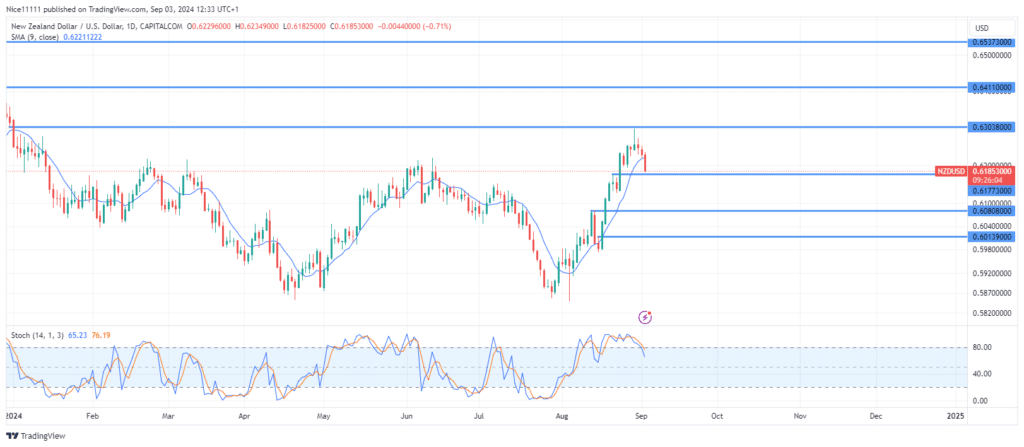
On August 23rd, NZDUSD established a bullish break of structure (BOS), reinforcing its bullish trend. The price then encountered resistance, forming a swing high, which led to a decline towards the bullish order block at 0.61870.
On August 29th, a pinbar candle formed after the price reached the supply zone at 0.6040. The body of the pinbar, located at the lower end, indicated bearish pressure. Subsequent daily closes have shown lower prices, suggesting a correction or retracement phase within the upward trend.
The price is currently declining towards the nearest support level, identified as the last up-close candle featuring a fair value gap. This high-probability bullish order block signifies a potential area of support due to market inefficiency. The price has also fallen below the 9-period Moving Average, further indicating a retracement.
NZDUSD Short-Term Trend: Bullish
The higher timeframe retracement is showing as a bearish shift in market structure (SMS) on the 4-hour chart. The price is approaching the demand zone at 0.61770, with the Stochastic already indicating an oversold condition, suggesting readiness for a bullish reversal. A Change of Character (ChoCh) on the lower timeframes at the bullish order block could signal a strong trading opportunity and align with the best forex signals.
Trade on MT4 with Leverage up to 1:500! Trade on MT4 with Leverage up to 1:500!
X
We use cookies to ensure that we give you the best experience on our website. If you continue to use this site we will assume that you are happy with it.