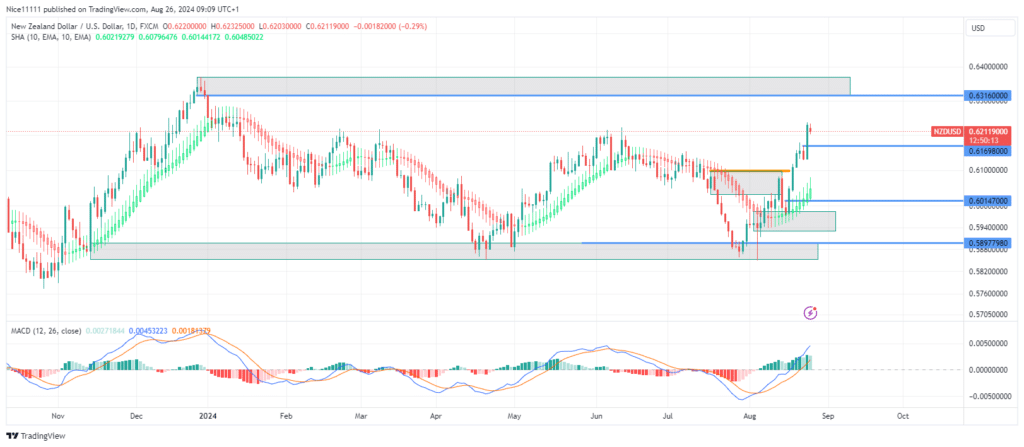
NZDUSD is steadily advancing towards the 0.63160 supply zone, driven by strong bullish momentum. This uptrend has emerged from the well-defended demand zone at 0.58980. Recently, the pair established a bullish break of structure, pushing past the previous swing high of 0.6200 and putting the resistance at 0.63160 within reach.
NZDUSD Key Levels
Demand Zones: 0.61700, 0.60179, 0.58980
Supply Zones: 0.63160, 0.64120, 0.65000
NZDUSD Long-Term Trend: Bullish
The MACD (Moving Average Convergence and Divergence) indicator has provided a precise forex signal for the bullish reversal seen in NZDUSD. Upon hitting the major demand zone at 0.58980, the MACD signaled that the market was oversold, resulting in a strong ascent starting in August. This upward movement successfully broke through the resistance posed by the bearish order block around 0.61000. The breakout was further supported by a bullish candlestick pattern known as the “three white soldiers,” which reinforced the upward trajectory.
Currently, the MACD continues to show rising bullish momentum. Additionally, the Smoothed Heikin Ashi candles are confirming the bullish trend, with green candles forming below the custom daily candles, which indicates sustained buying pressure in the market.
NZDUSD Short-Term Trend: Bullish
On the 4-hour chart, the price action shows the formation of an arc-like swing high. This suggests that a pullback to the bullish order block around 0.61700 could be on the horizon. Such a pullback would present a strong buying opportunity, setting the stage for the next upward move towards the key supply zone at 0.63160. Traders may find this setup favorable for generating the best forex signals and entering new long positions.
Trade on MT4 with Leverage up to 1:500! Trade on MT4 with Leverage up to 1:500!
X
We use cookies to ensure that we give you the best experience on our website. If you continue to use this site we will assume that you are happy with it.

 NZDUSD Short-Term Trend: Bullish
 NZDUSD Short-Term Trend: Bullish


