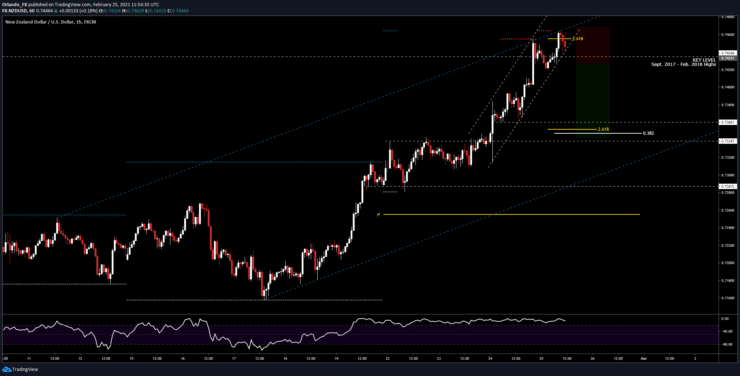
Key Resistance: 0.7460
Key Support: 0.7360 – 0.7340 -0.7287
Long Term View
The NZD/USD has been in a massive bull market since the March 2020 lows, up 36.20% or 1979 pips. We have hit a mayor key level now. The last time the NU was trading at these levels was back in February 2018 and at that time price dipped 26.5% for the next 750 days.
1H chart Analysis
Price is overextended here trading inside a very steep bullish structure and now testing the highs of the mid term bullish structure (blue channel).

Last week´s range was 158 pips and this week´s range is 183 pips. On avg. the NU moves around 135 pips per week so we are above that average weekly range at the top of the move.
This signal was sent to the Swing Trading Signals Channel with modified targets because we are riding a longer term move. If you want to get these targets and trade management you can join here: https://learn2.trade/forex-signals
- Broker
- Min Deposit
- Score
- Visit Broker
- Award-winning Cryptocurrency trading platform
- $100 minimum deposit,
- FCA & Cysec regulated
- 20% welcome bonus of upto $10,000
- Minimum deposit $100
- Verify your account before the bonus is credited
- Fund Moneta Markets account with a minimum of $250
- Opt in using the form to claim your 50% deposit bonus
Learn to Trade
Never Miss A Trade Again

Signal Notification
Real-time signal notifications whenever a signal is opened, closes or Updated

Get Alerts
Immediate alerts to your email and mobile phone.

Entry Price Levels
Entry price level for every signal Just choose one of our Top Brokers in the list above to get all this free.


