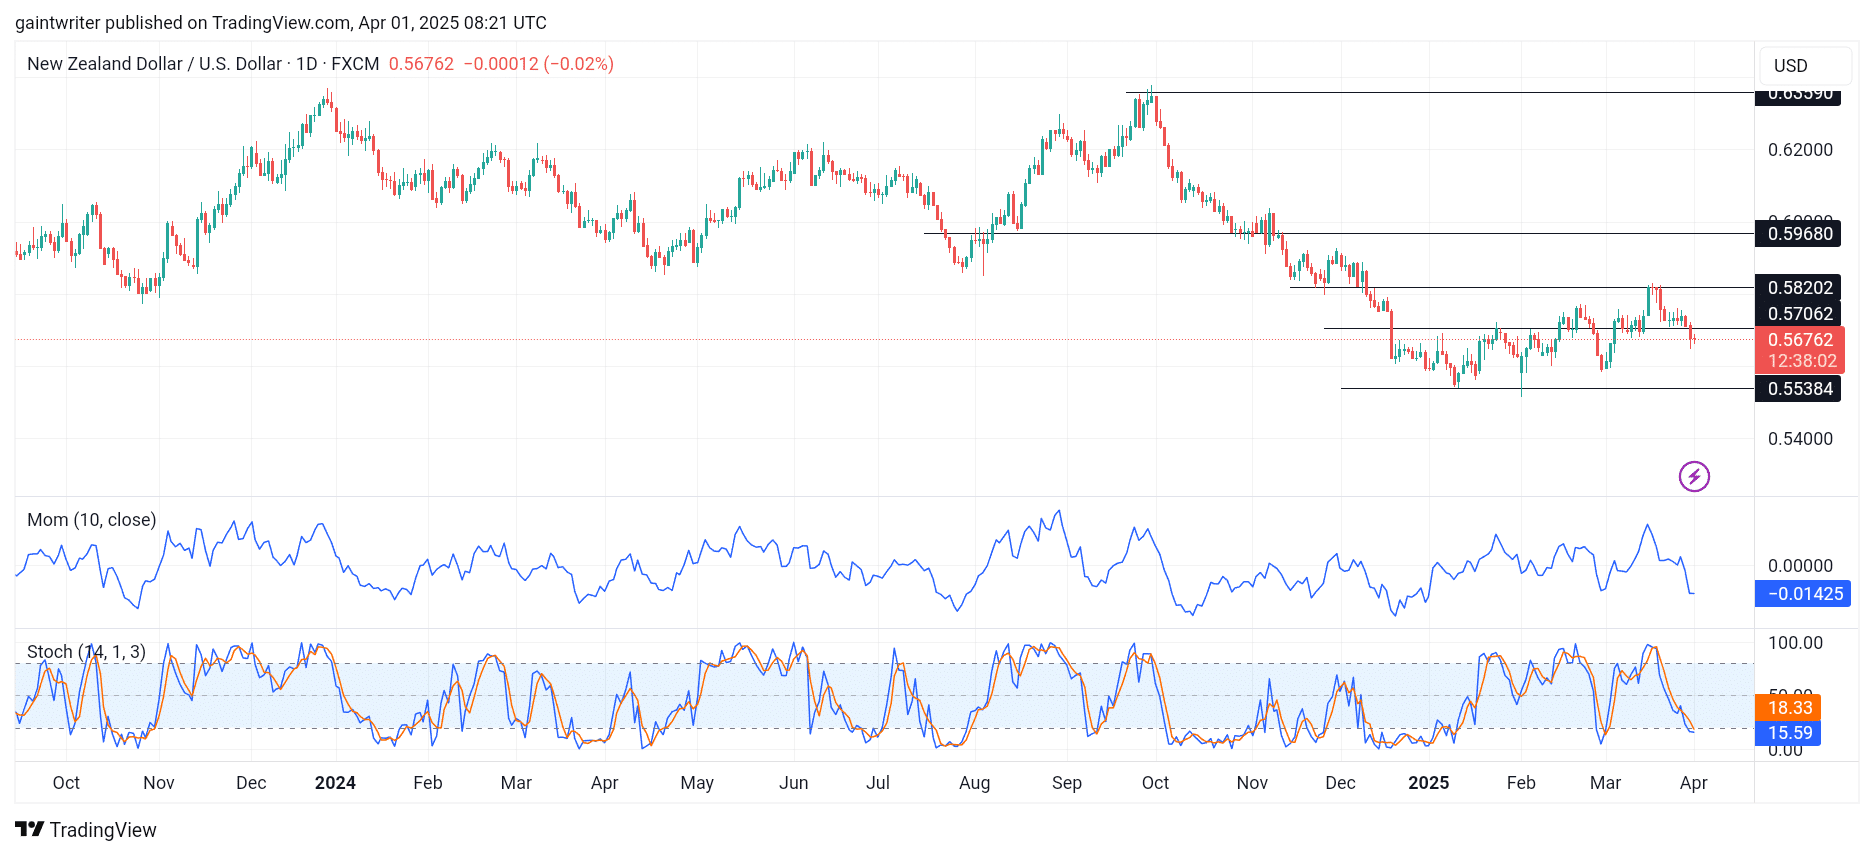
The NZDUSD currency pair is currently experiencing a strong bearish trend as sellers gain control of the market dynamics. The bears have made significant efforts to push prices lower, especially after crossing the critical support level at 0.56740.
NZDUSD Key Levels
Support Level: 0.55500, 0.53600 Resistance Level: 0.58350, 0.59000
NZDUSD Long-Term Trend: Bullish (Daily Chart)
Throughout early March, buyers had their moments, successfully escaping a consolidation phase and breaking beyond the 0.57170 key level. However, after the kiwi buyers managed a pull-up to the 0.58350 key level, they faced challenges penetrating higher. This struggle has allowed sellers to take control, resulting in a downward flip in price action.
Currently, sellers appear poised to push down to the 0.55500 market level, capitalizing on their momentum. As sellers intensified their efforts on the daily chart, the Momentum indicator reflects a steady decline in market strength. The buyers’ strength has weakened significantly, and the Stochastic Oscillator indicates that sellers are maintaining control. The Momentum indicator shows a deeper bearish flow following the recent drop. The Stochastic Oscillator continues to pull lower, reinforcing the bearish sentiment in the market.
NZDUSD Short-Term Trend: Bearish (4hour chart)
The outlook for NZDUSD suggests that the bearish trend is likely to continue as sellers remain aggressive. If the current momentum persists, a drop to the 0.55500 market level could be imminent.
Traders should monitor the Momentum indicator and Stochastic Oscillator closely for any signs of reversal or further bearish movement. A sustained push below the current levels could reinforce the bearish outlook and lead to additional downside potential
Trade on MT4 with Leverage up to 1:500! Trade on MT4 with Leverage up to 1:500!
X
We use cookies to ensure that we give you the best experience on our website. If you continue to use this site we will assume that you are happy with it.
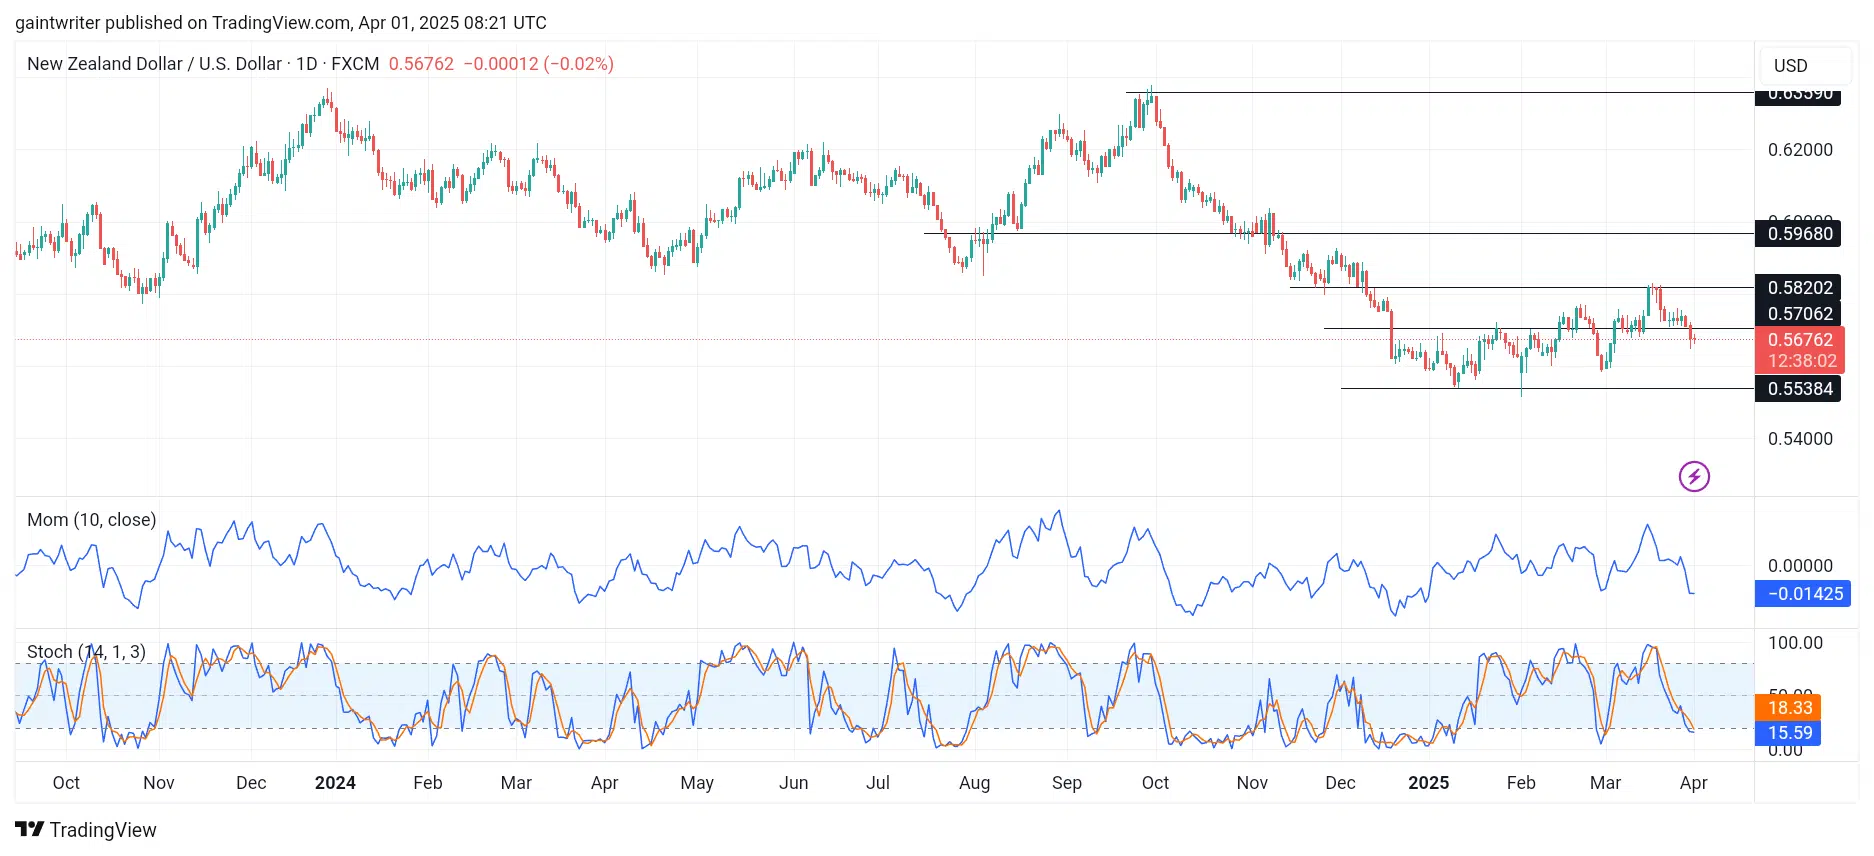
 NZDUSD Short-Term Trend: Bearish (4hour chart)
 NZDUSD Short-Term Trend: Bearish (4hour chart)


