

Key Resistance Levels: 0.7000, 0.7200, 0.7400
Key Support Levels: 0.6200, 0.6000, 0.5800
NZD/USD Price Long-term Trend: Ranging
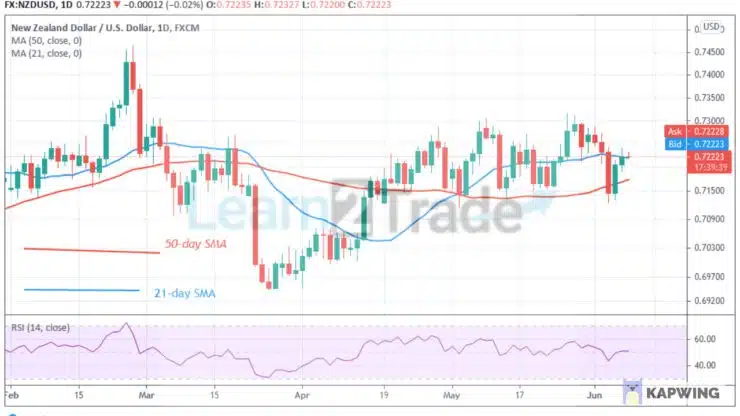
NZD/USD is in a sideways move below level 0.7300 Since April. The currency pair has been fluctuating between levels 0.7150 and 0.7300. Today, the currency has risen and it is breaking above the moving averages. This will propel price to rise and break the resistance levels.
Daily Chart Indicators Reading:
The Kiwi is at level 51 of the Relative Strength Index period 14. It indicates that there is a balance between supply and demand. The 21-day SMA and 50-day SMA are sloping horizontally indicating the sideways trend.
NZD/USD Medium-term Trend: Ranging
On the 4-hour chart, the Kiwi is also in a sideways trend below level 0.7300. Meanwhile, on June 7 uptrend; a retraced candle body tested the 78.6% Fibonacci retracement level. The retracement indicates that the market will rise to level 1.272 Fibonacci extension or the high of level 0.7267 and reverse.


