
Key Resistance Zones: 14000, 14100, 14200
Key Support Zones: 13400, 13300, 13200
NASDAQ 100 (NAS100) Long-term Trend: Ranging
NAS100 is in an upward move. Today, buyers are struggling to break above level 14000. Since February, the bulls are yet to break the resistance at level 14000. Each time, the resistance zone is tested, the market will decline to level 13000 or 12450. The index price has broken above the moving averages suggesting a possible retest at the previous high.
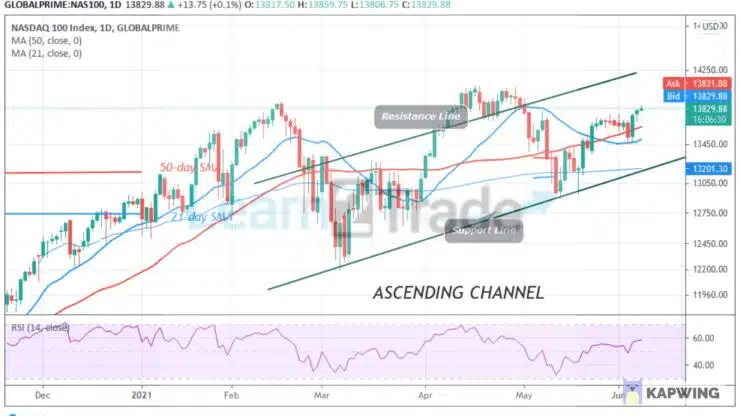
Daily Chart Indicators Reading:
NAS100 has risen to level 58 of the RSI period 14. It implies that the index is in the uptrend zone and above the centerline 50. The 50-day SMA and the 21-day SMA are sloping horizontally indicating the sideways move. The index price is above the moving averages which indicate a further upward move.
NASDAQ 100 (NAS100) Medium-term Trend: Bullish
On the 4- hour chart, the index is in an upward move approaching the overbought region. Meanwhile, on June 4 uptrend; a retraced candle body tested the 78.6% Fibonacci retracement level. The retracement indicates that the index will rise and reverse at level 1.272 Fibonacci extension or level 13853.26.


