
Key Resistance Zones: 14000, 14100, 14200
Key Support Zones: 13400, 13300, 13200
NASDAQ 100 (NAS100) Long-term Trend: Bullish
NASDAQ 100 slumps to level 13000 low and resumed a fresh uptrend. The index has broken above the moving averages indicating a possible rise in prices. The upward move has been facing resistance at level 14000. If the current bullish momentum is sustained the index will retest level 14000.
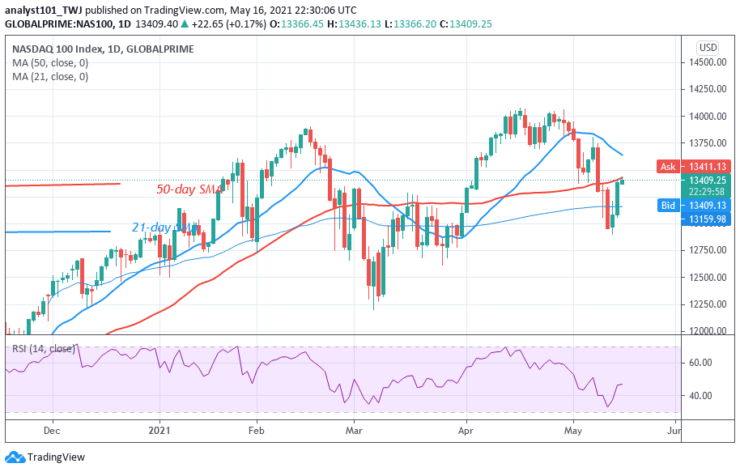
Daily Chart Indicators Reading:
NAS100 is at level 47 of the Relative Strength Index period 14. It indicates that the index is in the downtrend zone and capable of rising on the upside. The 50-day SMA and the 21-day SMA are sloping horizontally indicating the sideways move.
NASDAQ 100 (NAS100) Medium-term Trend: Ranging
On the 4- hour chart, the index fell to the low of level 12900 and found support above it. The Fibonacci tool has indicated an upward movement of the index. Meanwhile, on May 13 uptrend, a retraced candle body tested the 38.2% Fibonacci retracement level. This retracement indicates that the market will reach the high of level 2.618 Fibonacci extension or the high of 13673.53.


