NZD/USD Faces Rejection at Level 0.7300 as Kiwi Finds Support aboveLevel 0.7220

Azeez Mustapha

Updated:

Unlock Daily Forex Signals

Select a Plan

£39

1 - month
Subscription

Select

£89

3 - month
Subscription

Select

£129

6 - month
Subscription

Select

£399

Lifetime
Subscription

Select

£50

Separate Swing Trading Group

Select

Or

Get VIP forex signals, VIP crypto signals, swing signals, and forex course free for lifetime.

Just open an account with one our affiliate broker and make a minimum deposit: 250 USD.

Email [email protected] with a screenshot of funds on account to get access!

Sponsored by

Sponsored Sponsored
Checkmark

Service for copy trading. Our Algo automatically opens and closes trades.

Checkmark

The L2T Algo provides highly profitable signals with minimal risk.

Checkmark

24/7 cryptocurrency trading. While you sleep, we trade.

Checkmark

10 minute setup with substantial advantages. The manual is provided with the purchase.

Checkmark

79% Success rate. Our outcomes will excite you.

Checkmark

Up to 70 trades per month. There are more than 5 pairs available.

Checkmark

Monthly subscriptions begin at £58.


Key Resistance Levels: 0.7000, 0.7200, 0.7400
Key Support Levels: 0.6200, 0.6000, 0.5800

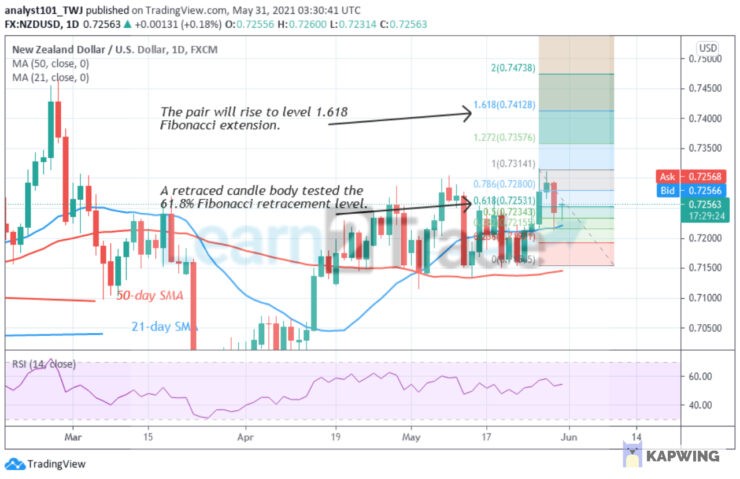
NZD/USD Price Long-term Trend: Ranging
Since April 28, NZD/USD is in a sideways move. On February 28, the bulls were repelled at the 0.7300 resistance as the market declined to level 0.7212. The pair is making another upward move at the recent low. Meanwhile, on May 26 uptrend, a retraced candle body tested the 61.8% Fibonacci retracement level. The retracement indicates that the pair will rise to level 1.618 Fibonacci extension or level 0.7412. The Kiwi may reach the recent high if the resistance at 0.7300 is breached.

Daily Chart Indicators Reading:
The Kiwi is at level 54 of the Relative Strength Index period 14. It indicates that the pair is in the uptrend zone and above the centerline 50. The 21-day SMA and 50-day SMA are sloping horizontally indicating the sideways trend.

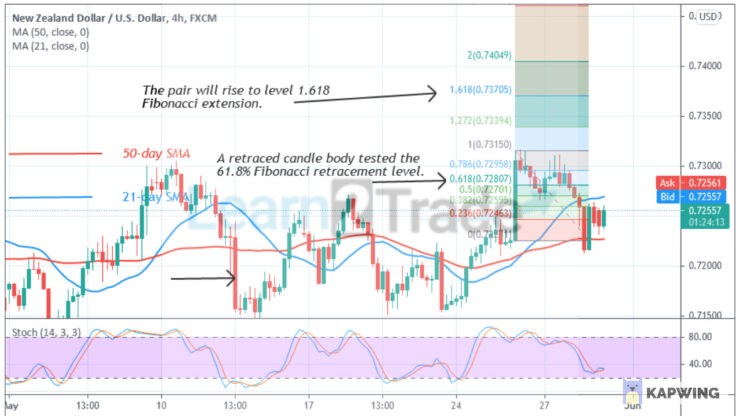
NZD/USD Medium-term Trend: Ranging
On the 4-hour chart, the Kiwi is also in a sideways trend below level 0.7300. Meanwhile, On May 26 uptrend; a retraced candle body tested the 61.8% Fibonacci retracement level. The retracement indicates that the market will rise to level 61.8 Fibonacci extension or the high of level 0.7370.

4-hour Chart Indicators Reading
The pair is above the 30% range of the daily stochastic. It indicates that the market is in a bullish momentum. The 21-day and 50-day SMAs are sloping horizontally indicating the sideways trend. The Kiwi price has a bullish crossover as the 21-day SMA crosses above the 50-day SMA.

General Outlook for NZD/USD
The NZD/USD pair is range-bound below the 0.7300 overhead resistance. The pair will resume upside momentum once the resistance at level 0.7300 is breached. Otherwise, the range-bound movement will linger on.


You can purchase crypto coins here: Buy Coins

Note: Learn2.Trade is not a financial advisor. Do your research before investing your funds in any financial asset or presented product or event. We are not responsible for your investing result

  • Broker
  • Benefits
  • Min Deposit
  • Score
  • Visit Broker
  • Award-winning Cryptocurrency trading platform
  • $100 minimum deposit,
  • FCA & Cysec regulated
$100 Min Deposit
9.8
  • 20% welcome bonus of upto $10,000
  • Minimum deposit $100
  • Verify your account before the bonus is credited
$100 Min Deposit
9
  • Over 100 different financial products
  • Invest from as little as $10
  • Same-day withdrawal is possible
$250 Min Deposit
9.8
  • The Lowest Trading Costs
  • 50% Welcome Bonus
  • Award-winning 24 Hour Support
$50 Min Deposit
9
  • Fund Moneta Markets account with a minimum of $250
  • Opt in using the form to claim your 50% deposit bonus
$250 Min Deposit
9

Share with other traders!

Azeez Mustapha

Azeez Mustapha is a trading professional, currency analyst, signals strategist, and funds manager with over ten years of experience within the financial field. As a blogger and finance author, he helps investors understand complex financial concepts, improve their investing skills, and learn how to manage their money.

Leave a Reply

Your email address will not be published. Required fields are marked *