
Key Resistance Zones: 14000, 14100, 14200
Key Support Zones: 13400, 13300, 13200
NASDAQ 100 (NAS100) Long-term Trend: Bearish
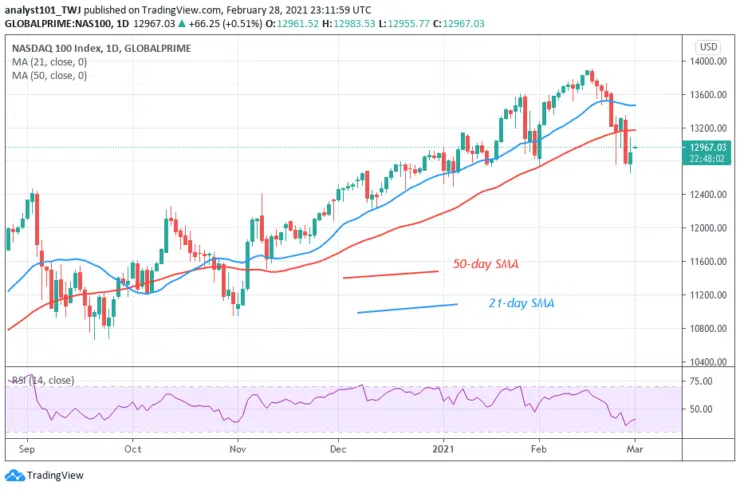
NAS100 is in an uptrend. The index reaches the high of level 13885 and was repelled. It fell to level 12757 and resumed upward.
Daily Chart Indicators Reading:
Presently, the SMAs are sloping upward indicating the uptrend. The index has risen to level 39 of the Relative Strength Index period 14. It indicates that it is in the uptrend zone above the centerline 50.
NASDAQ 100 (NAS100) Medium-term Trend: Bearish
On the 4- hour chart, the index is in a downward move. On February 23 downtrend; a retraced candle body tested the 50% Fibonacci retracement level. The retracement indicates that NAS100 will fall to level 2.0 Fibonacci extensions. That is the low of 11591.53.


