Key Resistance Zones: 14000, 14100, 14200
Key Support Zones: 13400, 13300, 13200
Nasdaq 100 (NAS100) Long-term Trend: Bearish
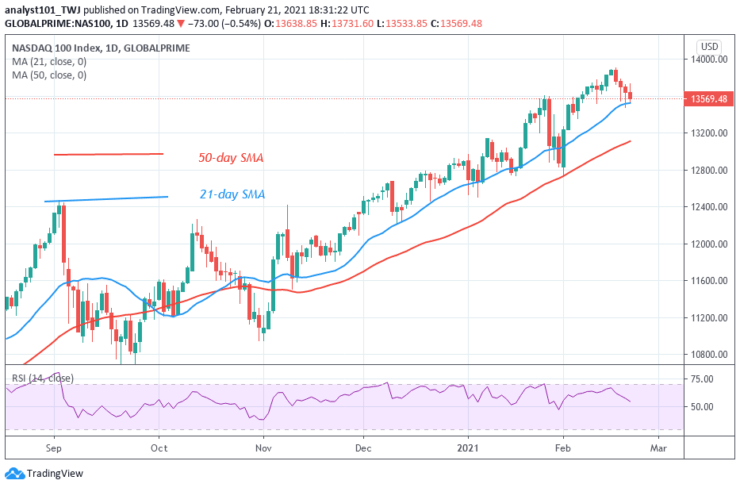
NAS100 was earlier in an uptrend. The upward move was terminated at level 13900 as the index resume downward move. The index fell to level 13500 as price corrected upward. The upward correction was repelled again at level 13700. The market is falling after the resistance at the recent high.
Daily Chart Indicators Reading:
Presently, the SMAs are sloping upward indicating the uptrend. The index has risen to level 59 of the Relative Strength Index period 14. It indicates that it is in the uptrend zone above the centerline 50.
Nasdaq 100 (NAS100) Medium-term Trend: Bearish
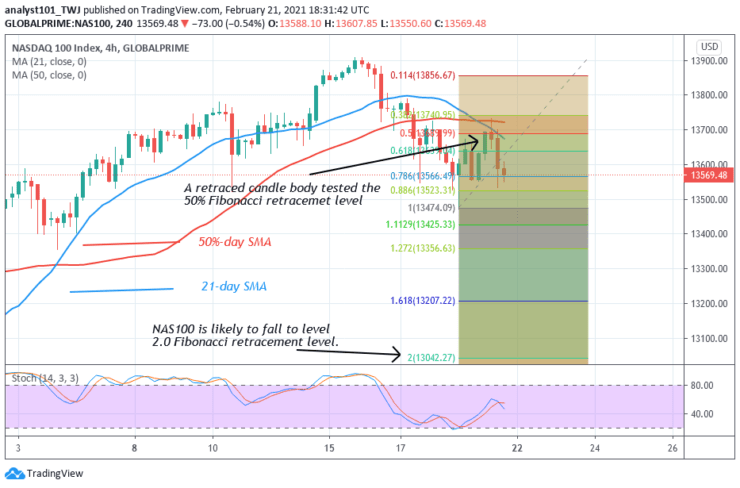
On the 4- hour chart, the index is in a downward move. On February 18 downtrend; a retraced candle body tested the 50% Fibonacci retracement level. The retracement indicates that NAS100 will fall to level 2.0 Fibonacci extensions. That is the low of 13042.27.
4-hour Chart Indicators Reading
The market is below the 40% range of the daily stochastic. It indicates that the index is in a bearish momentum. Meanwhile, the 50-day SMA and the 21-day SMA are sloping downward indicating the downtrend.
General Outlook for Nasdaq 100 (NAS100)
NAS100 is falling and approaching the low of level 13500. The downtrend will resume if the price breaks the current support level. The market will also resume an upward move if the current support holds.
You can purchase crypto coins here: Buy Coins
Note: Learn2.Trade is not a financial advisor. Do your research before investing your funds in any financial asset or presented product or event. We are not responsible for your investing results
- Broker
- Min Deposit
- Score
- Visit Broker

- Award-winning Cryptocurrency trading platform
- $100 minimum deposit,
- FCA & Cysec regulated

- 20% welcome bonus of upto $10,000
- Minimum deposit $100
- Verify your account before the bonus is credited
- Fund Moneta Markets account with a minimum of $250
- Opt in using the form to claim your 50% deposit bonus
Learn to Trade
Never Miss A Trade Again

Signal Notification
Real-time signal notifications whenever a signal is opened, closes or Updated

Get Alerts
Immediate alerts to your email and mobile phone.

Entry Price Levels
Entry price level for every signal Just choose one of our Top Brokers in the list above to get all this free.