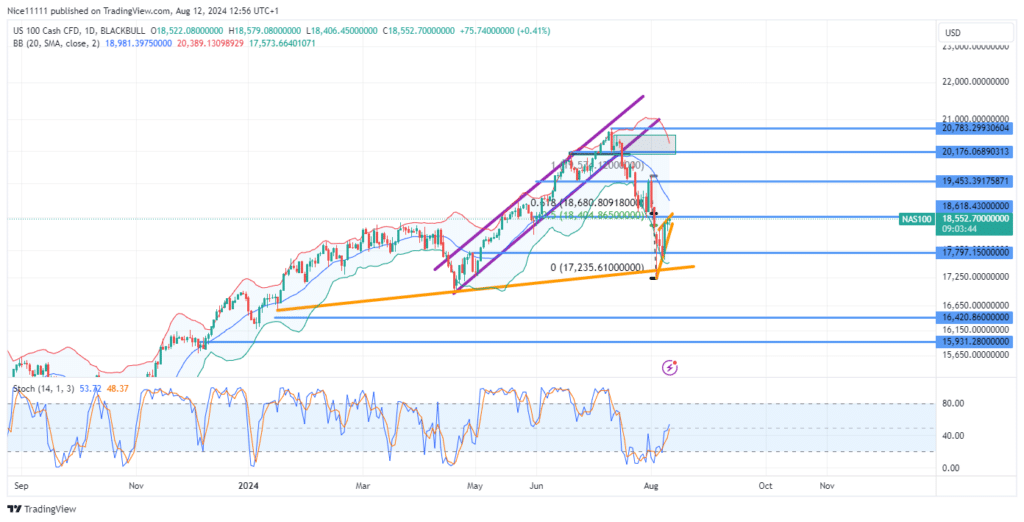
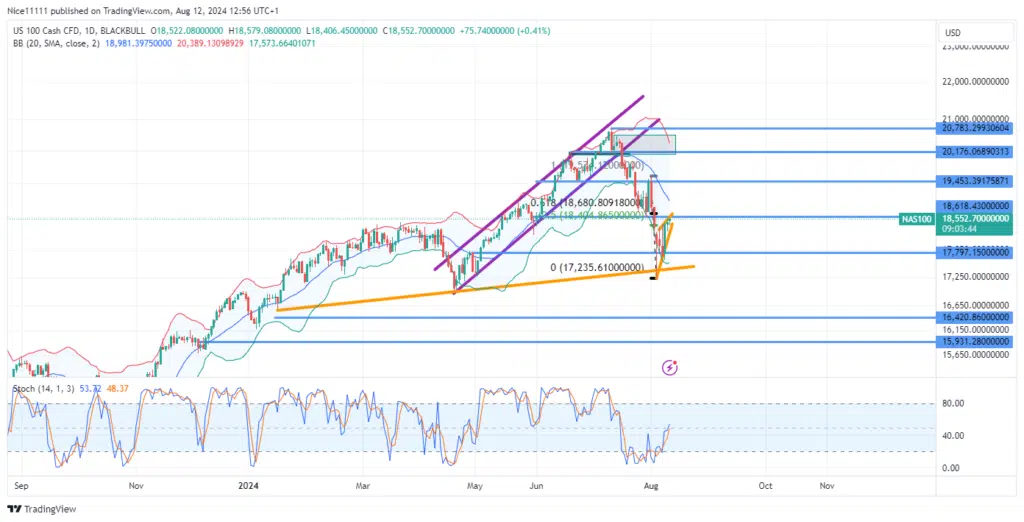
The NASDAQ 100 index, in July, experienced a bearish breakout, initiating the current downward trend visible on the daily chart. Recently, the price tested the demand level at 12,280, leading to a retracement that has pushed it into the premium zone of the bearish displacement.
The price movement below the Moving Averages within the Bollinger Bands indicator reflects a shift in market direction. Previously, during May and June, the price remained above the Moving Averages, indicating an uptrend.
The Stochastic indicator signaled a bullish exhaustion at 20,783.0. Initially, the price decline appeared to be a minor retracement, but upon reaching the demand level of 19,453.0, a complete reversal in price action occurred.
Nasdaq 100 Short-Term Trend: Bearish
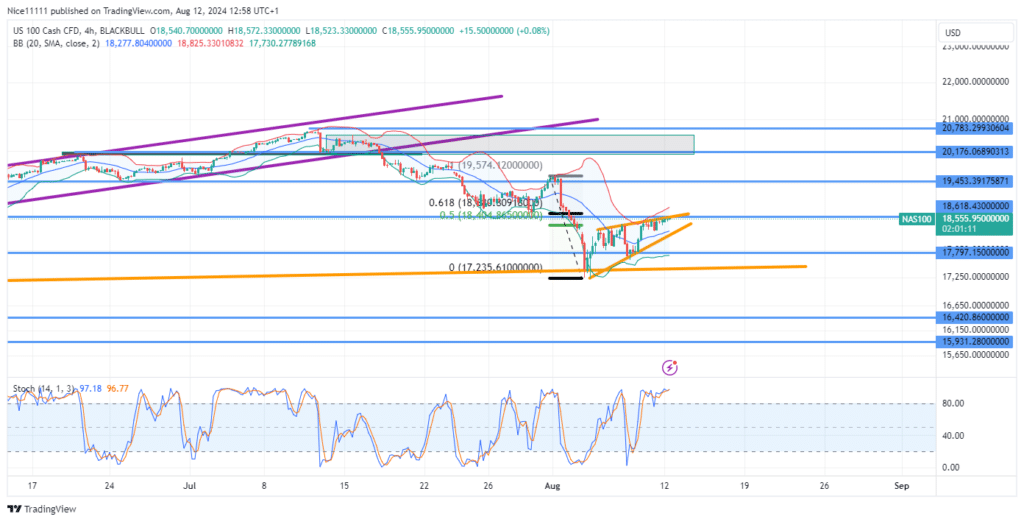
The recent bearish displacement from 19,453.0 to 17,791.0 has seen the price rise above 50% of its range, entering the premium zone. A bearish order block is present in this zone on the daily chart. A change in character is anticipated, which could establish forex signals with a favorable risk-to-reward ratio, aligning with the higher timeframe analysis.
Note: Learn2.trade is not a financial advisor. Do your research before investing your funds in any financial asset, product, or event. We are not responsible for your investment results.
Trade on MT4 with Leverage up to 1:500! Trade on MT4 with Leverage up to 1:500!
X
We use cookies to ensure that we give you the best experience on our website. If you continue to use this site we will assume that you are happy with it.