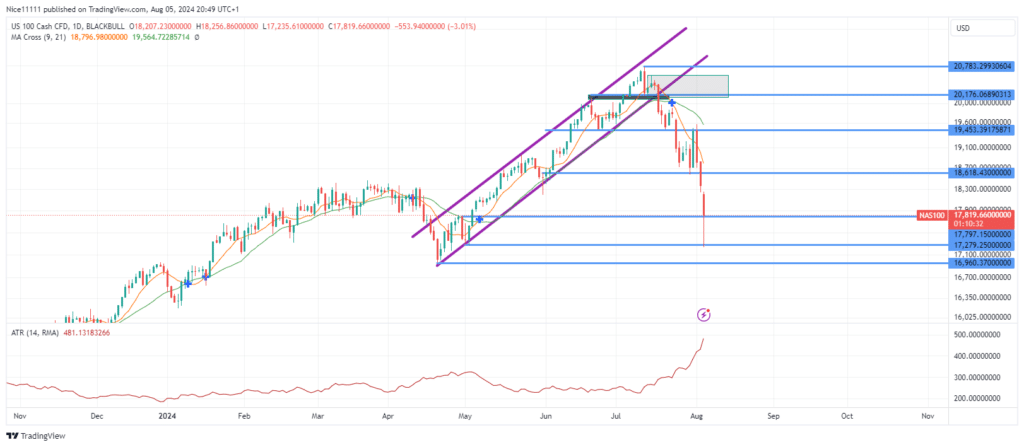
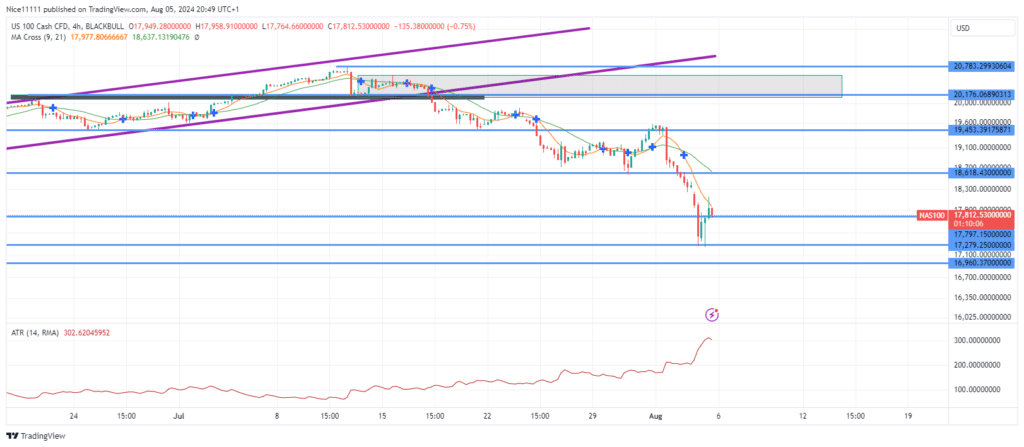
The Nasdaq (NAS100) has experienced a pronounced decline, with the index falling more than 17 percent from its peak of 20,771.0. This sharp downturn is evident from the large daily candles, highlighting substantial selling pressure.
Following a notable pullback in April, the Nasdaq experienced a rally within a bullish channel. However, the market reversal was indicated by the breakout from this channel. The price subsequently breached the demand level of 19,453.0. This shift has been characterized by increased volatility, with the Average True Range reaching its highest point of the year.
After touching the demand level of 18,618.0, a pullback occurred, hammering the bearish order block at 19,453.0. This provided an opportunity for significant short positions. Consequently, the price has rapidly penetrated the demand zones.
Nasdaq Short-Term Trend: Bearish
In the short term, the trend remains bearish. The daily and 4-hour charts show the price below the Moving Averages. Currently, the price is experiencing a pullback within this bearish trend, forming a shadow on the daily chart. It is anticipated that the price will resume its decline once it reaches the supply zone at 18,618.0. Leveraging forex signals can provide traders with timely insights to navigate these market dynamics and make informed decisions.
Note: Learn2.trade is not a financial advisor. Do your research before investing your funds in any financial asset, product, or event. We are not responsible for your investment results.
Trade on MT4 with Leverage up to 1:500! Trade on MT4 with Leverage up to 1:500!
X
We use cookies to ensure that we give you the best experience on our website. If you continue to use this site we will assume that you are happy with it.