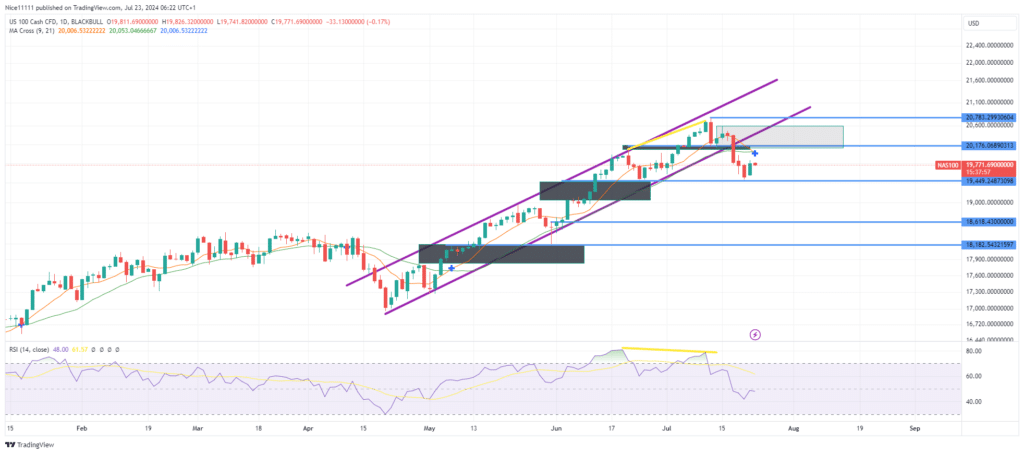
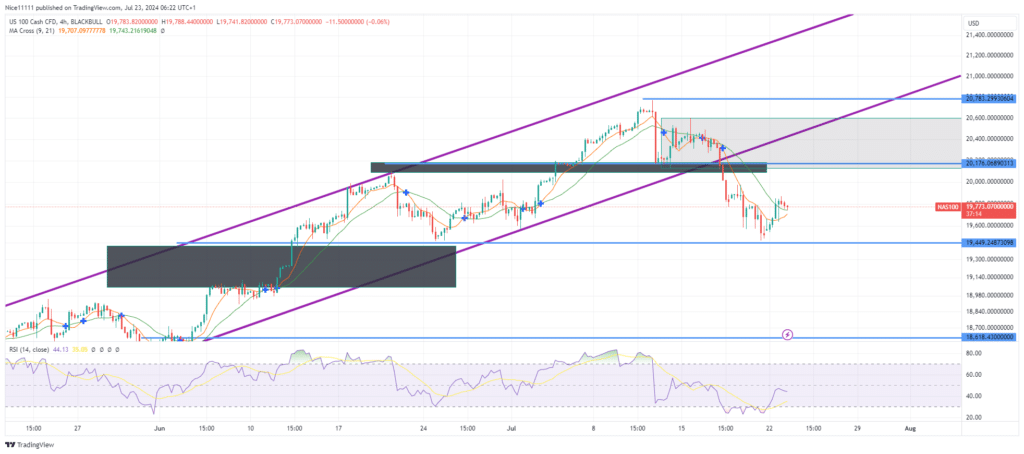
The Nasdaq 100 market experienced a significant retracement, transforming into a bearish breakout on the daily chart. The price has descended to challenge the demand zone at 19450.0.
On July 11, the Nasdaq price rebounded from a small bullish order block, causing a temporary pause in the price decline. However, a few days later, the price sank further, breaking through the support border of the upward channel.
The Relative Strength Index (RSI) indicated weakness just before the bearish breakout. While the price action posted a higher high on the daily chart, the RSI created a lower high, showing a divergence. Subsequently, the price declined below the Moving Averages (Periods 9 and 21).
Nasdaq Short-term Trend: Bearish
The recent price decline has dipped into the demand zone at 19450.0, characterized by a bullish order block. The lower timeframe trend is bearish due to the higher timeframe retracement. However, the price action in the demand zone on the lower timeframe suggests a potential reversal, indicating that buyers may prevent a complete shift in market structure on the higher timeframe. A confirmed Change of Character (ChoCh) is expected to provide long opportunities with a high risk-to-reward ratio. A push below 19450 would indicate a change in market direction, even on the daily chart, as the low of the demand zone sustains the bullish trend. Traders should watch for forex signals to confirm the potential reversal or continuation of the bearish trend.
Note: Learn2.trade is not a financial advisor. Do your research before investing your funds in any financial asset, product, or event. We are not responsible for your investment results.
Trade on MT4 with Leverage up to 1:500! Trade on MT4 with Leverage up to 1:500!
X
We use cookies to ensure that we give you the best experience on our website. If you continue to use this site we will assume that you are happy with it.