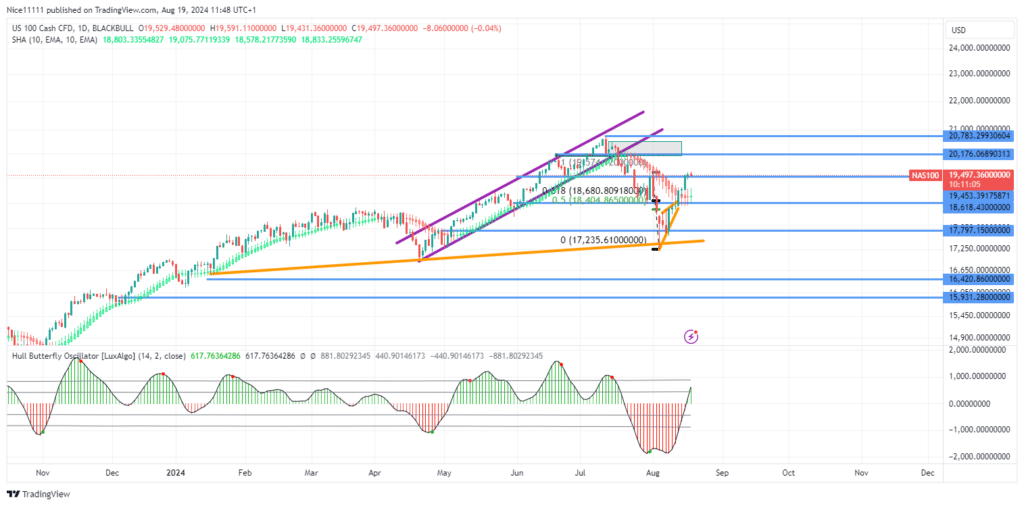
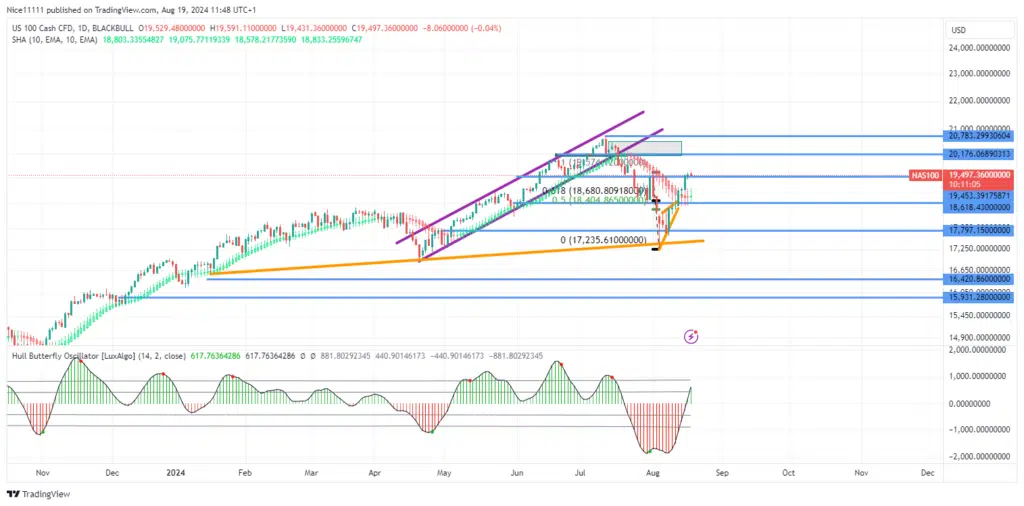
The NASDAQ 100 index is showing signs of a bullish reversal as buyers gradually take control of the market. Prices have broken past the last significant swing high on the daily chart, suggesting the possibility of an upcoming rally.
The recent bearish order block at 18,618.0 marked the last swing high before the market experienced a bearish displacement. Following this movement, the price dipped, leaving behind a narrow fair value gap. The subsequent drop to 17,797.0 mitigated an unfilled bullish order block. During this downturn, the Hull Butterfly indicator signaled an oversold market, with a green dot appearing in the negative region.
On the daily chart, the price has now moved above the Smoothed Heikin Ashi candles, indicating a strong and sustained upward movement. This reinforces a clear bullish trend, providing traders with valuable forex signals.
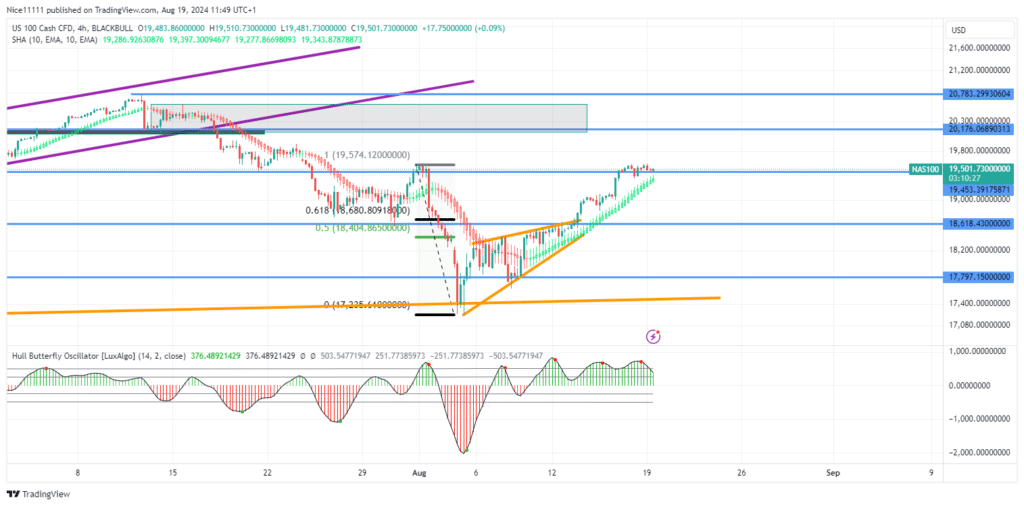
Nasdaq 100 Short-term Trend: Bearish
In the short term, the price hovered around the demand zone at 17,797.0 for several days before beginning its upward climb. Initially, this appeared to be a minor pullback within the broader bearish trend. However, the price has now surpassed the swing high at 19,453.0 on the daily chart, indicating a bullish shift in market structure.This shift suggests that the NASDAQ 100 could continue its ascent, with traders watching closely for further bullish signals in the coming days.
Note: Learn2.trade is not a financial advisor. Do your research before investing your funds in any financial asset, product, or event. We are not responsible for your investment results.
Trade on MT4 with Leverage up to 1:500! Trade on MT4 with Leverage up to 1:500!
X
We use cookies to ensure that we give you the best experience on our website. If you continue to use this site we will assume that you are happy with it.