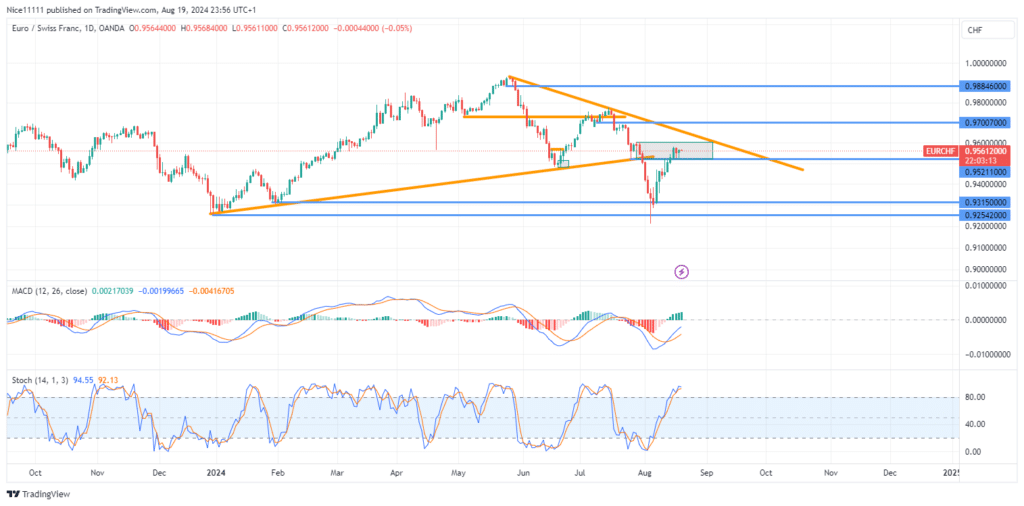
EURCHF is currently ascending towards a key resistance trendline on the daily chart. This move marks the third touch of the trendline, which connects two significant swing highs observed in May and July. As the price approaches this critical juncture, traders are watching closely for a potential resumption of the bearish trend or a breakout that could signal the start of a new bullish phase. The price action around this trendline will likely determine the market’s next directional bias.
EURCHF Key Levels
Demand Levels: 0.9320, 0.9250, 0.9000
Supply Levels: 0.9520, 0.9700, 0.9880
EURCHF Long-term Trend: Bearish
The EURCHF has been in a bearish trend since the price broke below the swing low of 0.9750, confirming a downward momentum. After the break, a small double top formed, contributing to further bearish displacement that invalidated a key supporting trendline.
The current retracement began following a test of the 0.9320 support level, leading to a short-term recovery. However, the Stochastic indicator now shows the pair in an overbought region, suggesting a potential reversal may be imminent. Additionally, the price is approaching a bearish order block, which serves as a significant resistance zone, and it is nearing the bearish trendline, reinforcing the likelihood of resistance in the coming sessions.
EURCHF Short-term Trend: Bullish
Despite the long-term bearish outlook, the short-term market structure for EURCHF remains bullish. On the lower timeframes, the price has consistently formed higher highs and higher lows from the demand zone at 0.9320. This bullish momentum has brought the price close to the bearish order block and the trendline resistance. If buyers can maintain control and push the price above these critical barriers, the bearish outlook may be invalidated, leading to a potential shift towards a new bullish trend.
Trade on MT4 with Leverage up to 1:500! Trade on MT4 with Leverage up to 1:500!
X
We use cookies to ensure that we give you the best experience on our website. If you continue to use this site we will assume that you are happy with it.

 EURCHF Short-term Trend: Bullish
 EURCHF Short-term Trend: Bullish


