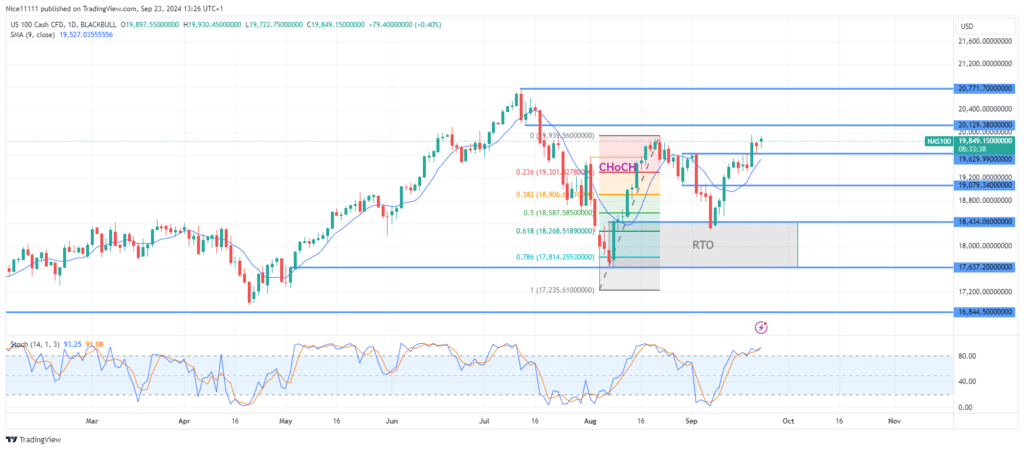
The Nasdaq 100 index has continued its upward momentum following a price pullback to the bullish order block at 18,434.0. The price has now risen beyond the swing high of 19,837.0, marking a bullish break of structure that strengthens the ongoing bullish trend on the daily chart.
The Nasdaq 100 market’s rise above the bearish order block at 19,591.0 in late August signaled the market’s intended direction in terms of order flow. The price pulled back to the discount region of the bullish displacement, which is below 50% of the range.
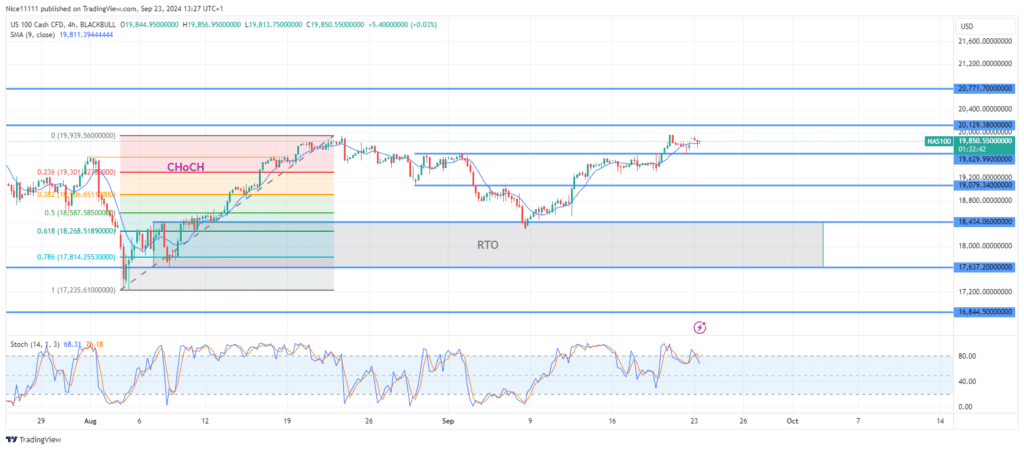
The Stochastic indicator showed that the market was oversold when it dipped into the order block at 18,434.0. This encouraged bullish orders, increasing buying activity from the demand zone. As a result, the price rose above the 9-period Moving Average. However, the ascent slowed down near the fair value gap just below 19,473.0. After a brief period of accumulation, the price surged, establishing a bullish break of structure and reinforcing the overall bullish stance.
Nasdaq 100 Long-Term Trend: Bullish
After breaking out above the key zone at 19,629.0, the price retested this level. The market is now expected to move towards 20,129.0, where this key zone is anticipated to act as resistance for the uptrend. If the resistance at 20,129.0 is broken, the market could potentially reach a new all-time high. Forex signals suggest traders should watch for further bullish moves as this trend develops.
Note: Learn2.trade is not a financial advisor. Do your research before investing your funds in any financial asset, product, or event. We are not responsible for your investment results.
Trade on MT4 with Leverage up to 1:500! Trade on MT4 with Leverage up to 1:500!
X
We use cookies to ensure that we give you the best experience on our website. If you continue to use this site we will assume that you are happy with it.