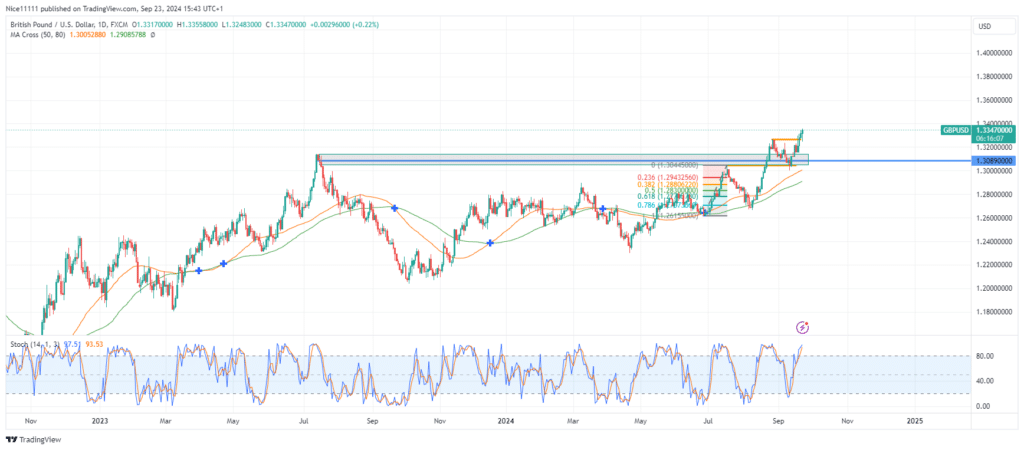
GBPUSD price experienced a significant bullish breakout above the key resistance level of 1.30890 on August 23. Following this breakout, the price retraced to retest the zone, which has now turned into a strong support, further driving the ongoing bullish momentum. The upward movement from this newly formed demand zone pushed the price to 1.33330, leading to another bullish break of structure.
On the daily chart, GBPUSD price initially encountered resistance at the 1.30890 level, prompting a pullback to 1.26840, which represented 78.6% of the previous bullish move, as indicated by the Fibonacci tool. This pullback tested the 80-period Moving Average, providing support and reigniting the bullish trend.
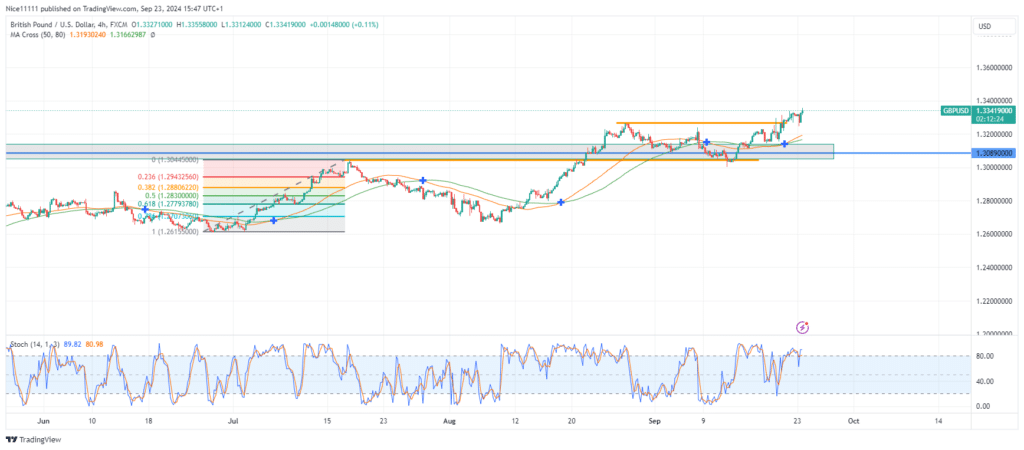
A series of bullish candles then propelled the price beyond the resistance zone, reaching a swing high of 1.32750. However, buyer exhaustion led to a retracement back to the previous resistance at 1.30890, now serving as support. This support zone has enabled the price to push higher, resulting in a new bullish break of structure above 1.32570.
GBPUSD Short-Term Trend: Bullish
In the short term, the bullish trend remains strong, reinforced by the alignment of Moving Averages. However, there is a possibility of a pullback as both higher and lower timeframes show overbought conditions on the Stochastic indicator. Despite this, GBPUSD is targeting the next key level at 1.35000, and forex signals suggest traders should monitor for further upside potential.
Note: Learn2.trade is not a financial advisor. Do your research before investing your funds in any financial asset, product, or event. We are not responsible for your investment results.
Trade on MT4 with Leverage up to 1:500! Trade on MT4 with Leverage up to 1:500!
X
We use cookies to ensure that we give you the best experience on our website. If you continue to use this site we will assume that you are happy with it.