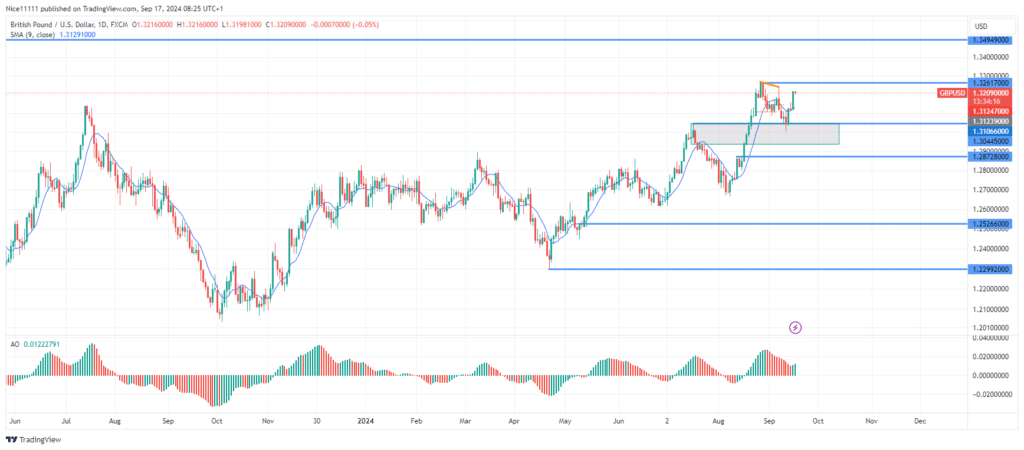
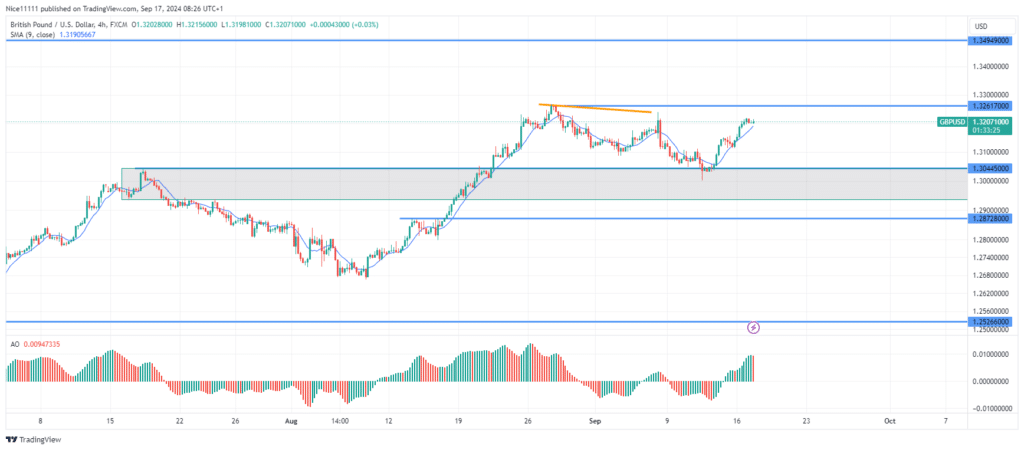
GBPUSD price recently entered a correction phase following a significant bullish impulse move from 1.26500 to 1.32620. The retracement brought the price back down to find support at the bullish break block around 1.31070, where buyers re-entered the market. After testing this support zone, the upward trend has resumed, as shown by the price action. The renewed bullish momentum is expected to push prices toward higher levels in the coming days.
During August, GBPUSD price exhibited a strong bullish trend, marked by the formation of three white soldiers—a bullish candlestick pattern that signaled a significant break of structure above 1.31070. After this move, the market experienced a pullback, seeking support to reinforce the upward trend.
Following the test of the bullish break block at 1.31070, the price regained upward momentum. The Awesome Oscillator now displays green bars above the zero line, confirming increasing bullish strength and a positive long-term outlook for the pair.
GBPUSD Short-term Trend: Bullish
Both the daily and 4-hour charts show the 9-period Moving Average offering solid support for the pair’s upward movement. The price is now approaching the previous high of 1.32620, with expectations that it could test higher supply levels soon. The use of reliable forex signals could guide traders during this bullish trend.
Note: Learn2.trade is not a financial advisor. Do your research before investing your funds in any financial asset, product, or event. We are not responsible for your investment results.
Trade on MT4 with Leverage up to 1:500! Trade on MT4 with Leverage up to 1:500!
X
We use cookies to ensure that we give you the best experience on our website. If you continue to use this site we will assume that you are happy with it.