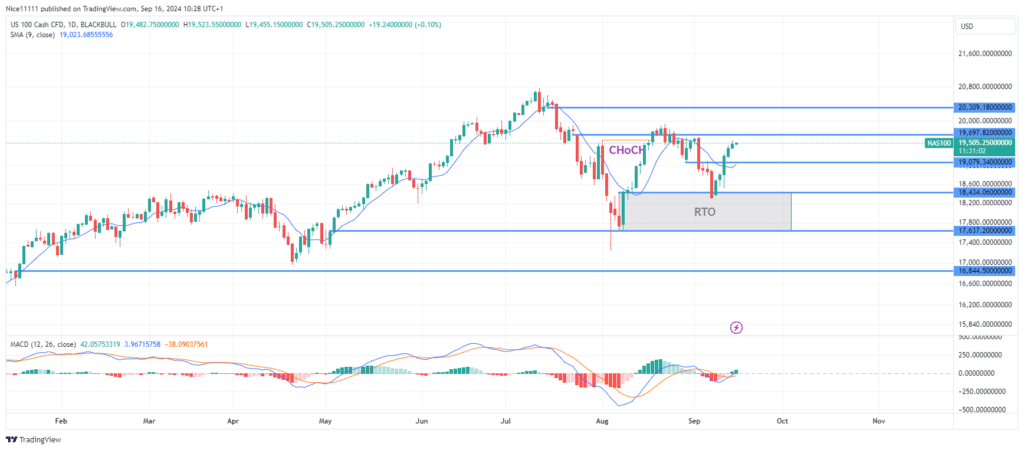
The Nasdaq 100 index has gained significant bullish momentum following a recent pullback. Earlier this month, the price retraced to a dip at 18,434.0, which triggered strong buying pressure, driving the price higher and reinforcing the prevailing uptrend.
In mid-August, the MACD (Moving Average Convergence and Divergence) histogram showed a gradual decrease in bar length, indicating weakening bullish momentum. This led to a price drop, with daily candles closing below the 9-period Moving Average.
By late August, prices had fallen into the discount region, which lies below 50% of the ascent range. This created an ideal entry point for buyers, who, using the best forex signals, took advantage of the dip. The bulls successfully pushed prices back towards the swing high of 19,697.0, suggesting a possible bullish break of structure (BOS).
Nasdaq 100 Short-term Trend: Bullish
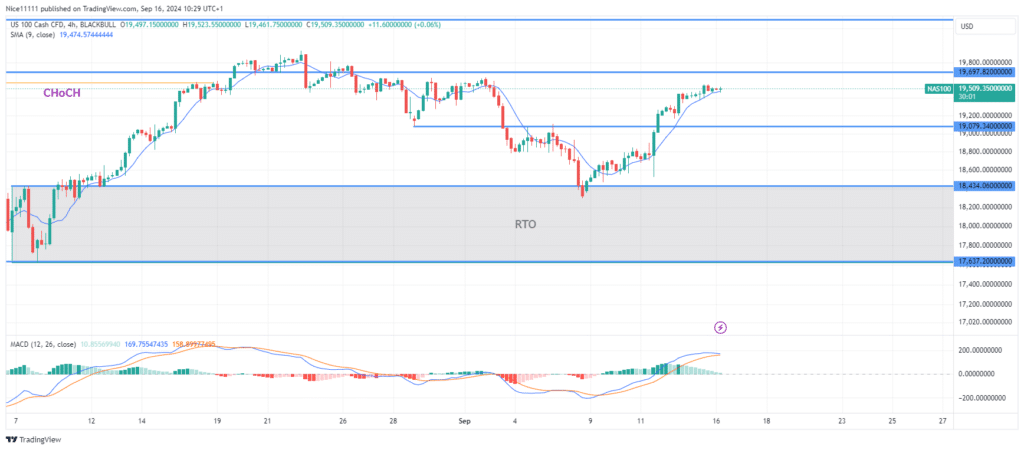
On the 4-hour chart, a strong bullish trend has developed from the demand level of 18,434.0. The 9-period Moving Average closely follows the candlesticks, supporting upward movement across both higher and lower timeframes. A break above 19,697.0 could propel the market further, with the next major target at the psychological level of 20,000.0.
Note: Learn2.trade is not a financial advisor. Do your research before investing your funds in any financial asset, product, or event. We are not responsible for your investment results.
Trade on MT4 with Leverage up to 1:500! Trade on MT4 with Leverage up to 1:500!
X
We use cookies to ensure that we give you the best experience on our website. If you continue to use this site we will assume that you are happy with it.