NAS100 Analysis – November 2
NAS100 sustains its upward trajectory backed by persistent buyer momentum. The NAS100 index continues to exhibit a strong bullish outlook, maintaining a well-defined upward formation supported by the 9-day Simple Moving Average (SMA), currently positioned around $25,620. Price movement remains comfortably above this dynamic support zone, reflecting strong investor confidence and consistent accumulation behavior. Momentum indicators, particularly the RSI hovering near 64, confirm continued buying strength with minimal signs of exhaustion, suggesting that bullish control remains firm within the medium-term framework.
NAS100 Key Levels
Resistance Levels: $26,040, $27,000, $28,000
Support Levels: $25,000, $24,050, $23,000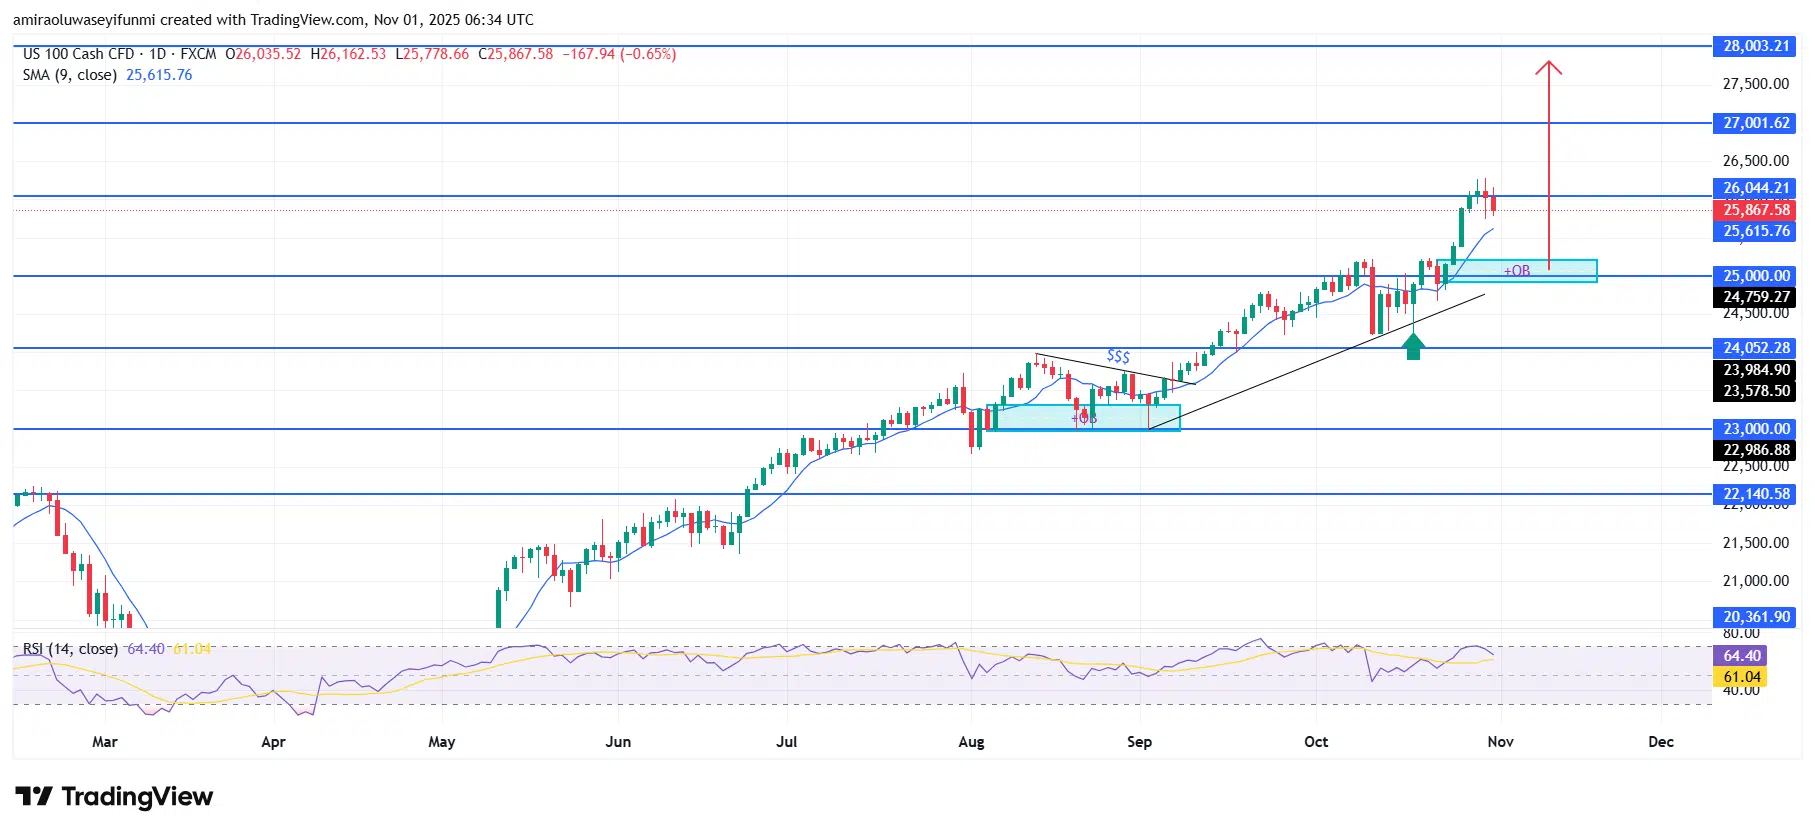
NAS100 Long-Term Trend: Bullish
Technically, the index has recently regained strength from the $25,000 structural base—an area where previous resistance has transitioned into a reliable support level. This consolidation zone acted as a launch point for renewed appreciation following a brief corrective phase. The broader market structure remains aligned with its ascending trajectory established since mid-September, affirming the consistency of its upward rhythm. The minor dip toward $25,870 reflects a routine market correction within a sustained continuation pattern rather than a structural breakdown.
Looking ahead, NAS100 appears favorably positioned to target the $27,000 resistance area, which stands as a critical decision point for bullish participants. A confirmed breakout above this region could extend momentum toward $28,000, supported by persistent optimism across global equity markets. Should short-term retracements occur, the $25,000–$25,600 range is expected to act as a firm demand zone, cushioning temporary declines and encouraging renewed buying activity as seen in consistent forex signals across correlated markets.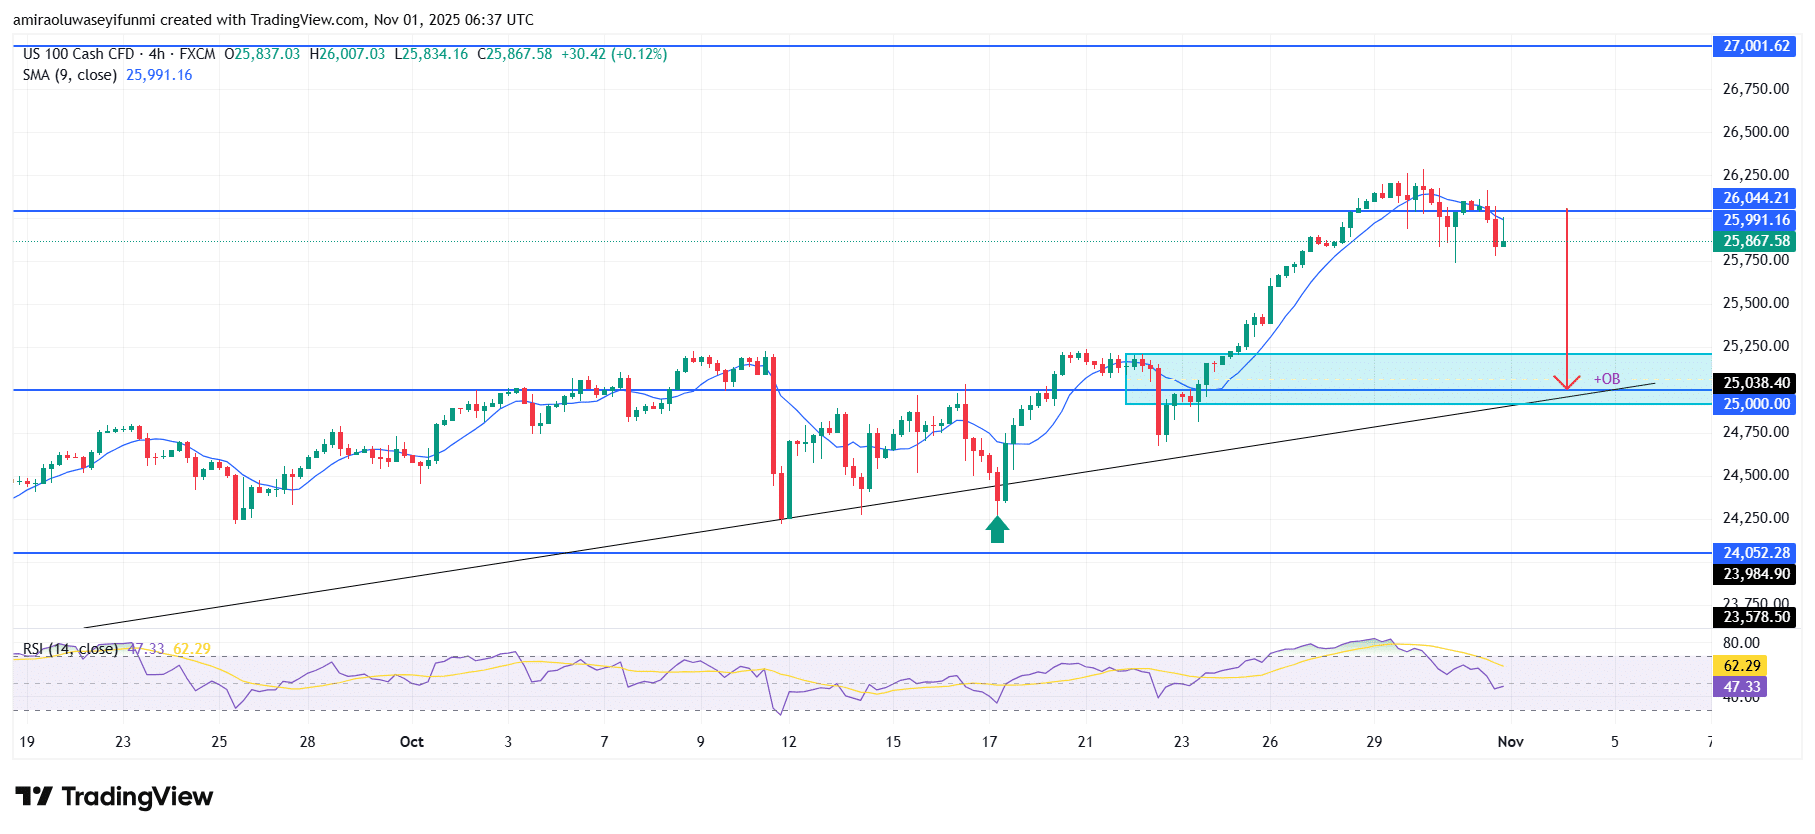
NAS100 Short-Term Trend: Bearish
NAS100 currently faces short-term bearish pressure as price encounters resistance near the $26,040 zone. The index has slipped below the 9-day SMA around $25,990, indicating a temporary loss in buyer momentum. RSI has turned slightly lower around 47, signaling growing seller activity. A potential retracement toward the $25,000–$25,050 order block remains probable before the market regains upward traction.
Make money without lifting your fingers: Start using a world-class auto trading solution
How To Buy Lucky Block
Note: Learn2.trade is not a financial advisor. Do your research before investing your funds in any financial asset, product, or event. We are not responsible for your investment results.
- Broker
- Min Deposit
- Score
- Visit Broker

- Award-winning Cryptocurrency trading platform
- $100 minimum deposit,
- FCA & Cysec regulated

- 20% welcome bonus of upto $10,000
- Minimum deposit $100
- Verify your account before the bonus is credited
- Fund Moneta Markets account with a minimum of $250
- Opt in using the form to claim your 50% deposit bonus
Learn to Trade
Never Miss A Trade Again

Signal Notification
Real-time signal notifications whenever a signal is opened, closes or Updated

Get Alerts
Immediate alerts to your email and mobile phone.

Entry Price Levels
Entry price level for every signal Just choose one of our Top Brokers in the list above to get all this free.