

NAS100 Analysis – December 21
NAS100 signals emerging medium term downside risk. NAS100 is transitioning into a consolidation phase following a prolonged upward move, with key momentum indicators no longer confirming the strength observed earlier in the rally. Price action is fluctuating around the 9-day and 21-day moving averages near $25,300, both of which have started to flatten, indicating a loss of directional commitment. Meanwhile, the MACD is hovering close to its equilibrium line, reflecting fading upside momentum and increasing the probability of a broader trend adjustment.
NAS100 Key Levels
Resistance Levels: $26040, $27000, $28000
Support Levels: $24050, $23000, $22140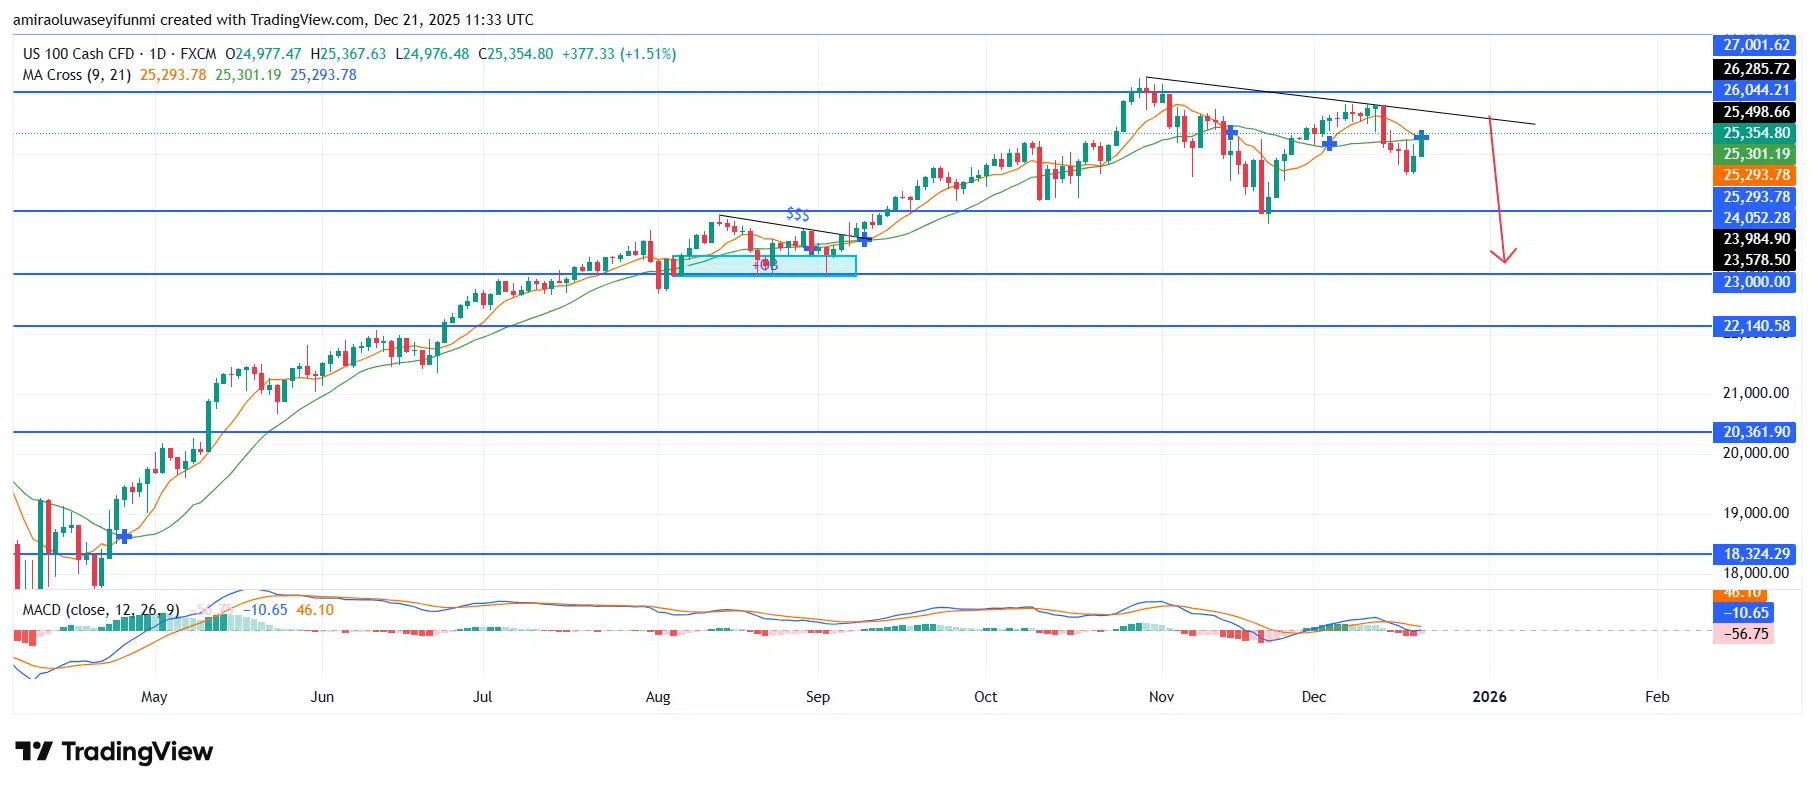
NAS100 Long-Term Trend: Bullish
From a technical perspective, the index has struggled to maintain acceptance above the downward-sloping resistance zone near $26,000, suggesting that supply continues to dominate at higher price levels. Recovery efforts have lacked follow-through, while the former support area around $25,500 has transitioned into an overhead resistance zone. The evolution from consistent higher highs to an emerging pattern of lower highs points to a gradual shift in control from buyers to sellers.
From a forward-looking standpoint, a decisive break below the $25,000–$24,900 region would likely expose the index to renewed selling pressure toward the $24,000 level, where earlier demand was established. Sustained weakness could extend the corrective move toward $23,600, with additional downside risk toward $22,100 over the medium term. Within this environment, rallies are increasingly viewed as corrective in nature and aligned with prevailing forex signals rather than indications of trend resumption.
NAS100 Short-Term Trend: Bearish
Make money without lifting your fingers: Start using a world-class auto trading solution
How To Buy Lucky Block
Note: Learn2.trade is not a financial advisor. Do your research before investing your funds in any financial asset, product, or event. We are not responsible for your investment results.


