Key Resistance Zones: 16000, 16500, 17000
Key Support Zones: 13500, 13000, 12500
NASDAQ 100 (NAS100) Long-term Trend: Bearish
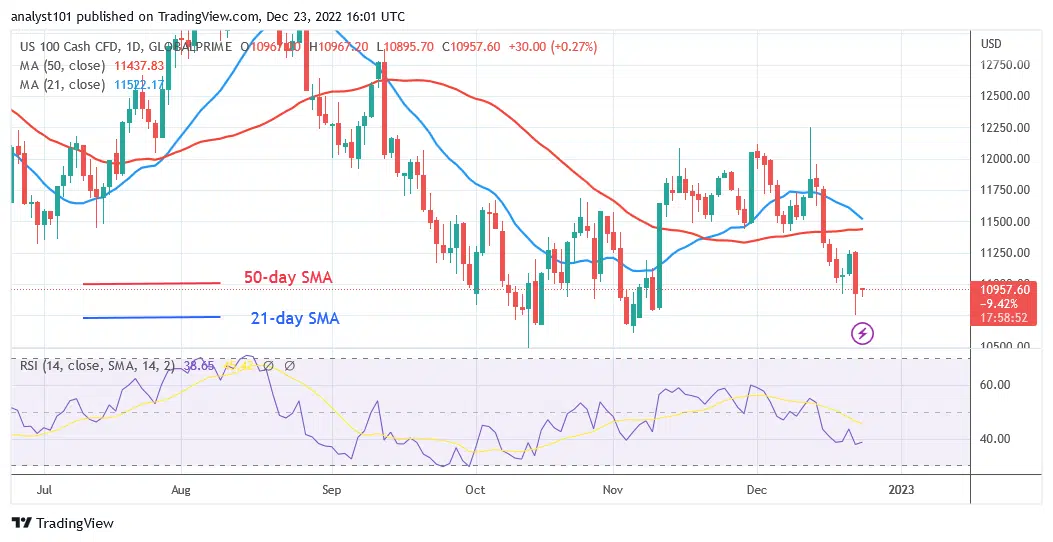
The NAS100 price is falling as it revisits level 10661.40. Since November 15, buyers have been attempting to break through the resistance at level 12000. Nonetheless, after three failed attempts, the NAS100 fell below the moving average lines. Today, the index has dropped to a low of 10753 as bulls buy dips. Buyers have been defending the current support level of 10600 since October 13.
Daily Chart Indicators Reading:
For period 14, the NAS100 is at level 38 on the Relative Strength Index. The index has entered a bearish trend zone. The price bars are below the moving average lines, indicating that the price is likely to fall further. The 21-day and 50-day SMA lines’ horizontal slope suggests that the market is moving sideways.
NASDAQ 100 (NAS100) Medium-term Trend: Bearish
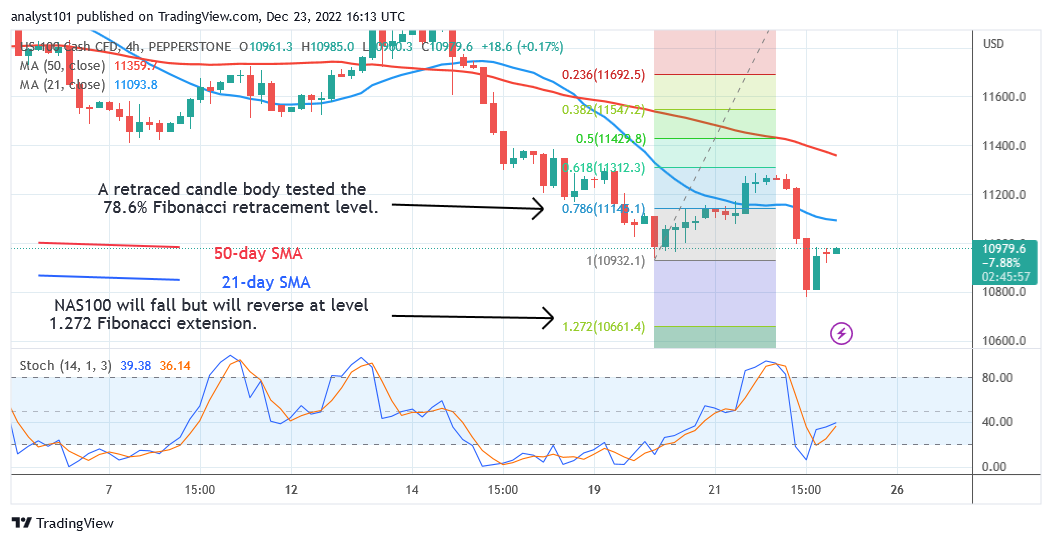
The NAS100 is declining on the 4-hour chart as price breaks below the 21-day line SMA. The index dropped to a low of 10780.20 before pulling back. It rose following a downward correction on December 20 and a retraced candle body that tested the 78.6% Fibonacci retracement level. According to the correction, the NAS100 will drop but will turn around at the level of the 1.272 Fibonacci extension, or level 10661.40.
4-hour Chart Indicators Reading
The NAS100 has a bullish momentum above the daily Stochastic level of 25. The 21-day and 50-day SMA lines both slope downward, indicating a downward trend.
General Outlook for NASDAQ 100 (NAS100)
The NAS100 is still in a downtrend as it revisits level 10661.40. The index reached oversold territory on December 22 as bulls bought the dips. The price indicator predicts that the NAS100 will reverse at the 1.272 Fibonacci extension, or level 10661.40.
You can purchase crypto coins here: Buy LBLOCK
Note: Learn2.Trade is not a financial advisor. Do your research before investing your funds in any financial asset or presented product or event. We are not responsible for your investing results
- Broker
- Min Deposit
- Score
- Visit Broker

- Award-winning Cryptocurrency trading platform
- $100 minimum deposit,
- FCA & Cysec regulated

- 20% welcome bonus of upto $10,000
- Minimum deposit $100
- Verify your account before the bonus is credited
- Fund Moneta Markets account with a minimum of $250
- Opt in using the form to claim your 50% deposit bonus
Learn to Trade
Never Miss A Trade Again

Signal Notification
Real-time signal notifications whenever a signal is opened, closes or Updated

Get Alerts
Immediate alerts to your email and mobile phone.

Entry Price Levels
Entry price level for every signal Just choose one of our Top Brokers in the list above to get all this free.