Key Resistance Zones: 16000, 16500, 17000
Key Support Zones: 13500, 13000, 12500
NASDAQ 100 (NAS100) Long-term Trend: Bearish
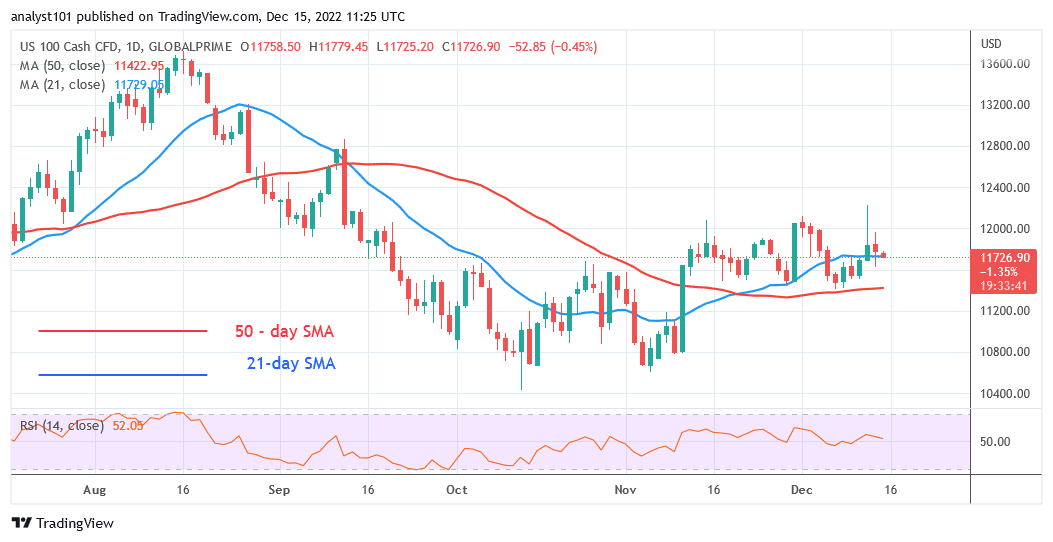
The NAS100 is currently trading in a bearish trend zone as it faces further rejection. The index is currently declining after reaching resistance at the most recent high. Level 10800 will be the lowest point of the decline. The index is currently bouncing back and forth between the moving average lines, but it did so on December 12. The level 12000 resistance has stopped the price’s upward movement. The 21-day line SMA is being breached once again by the NAS100. If the price declines below the 50-day SMA, the downtrend will resume.
Daily Chart Indicators Reading:
On the Relative Strength Index for period 14, the NAS100 is at level 52. It implies that the index is still in the bullish trend zone despite the retracement. Because the price bars are between the moving average lines, the trend will remain horizontal. The 21-day and 50-day SMA lines are sloping sideways indicating the trend.
NASDAQ 100 (NAS100) Medium-term Trend: Bearish
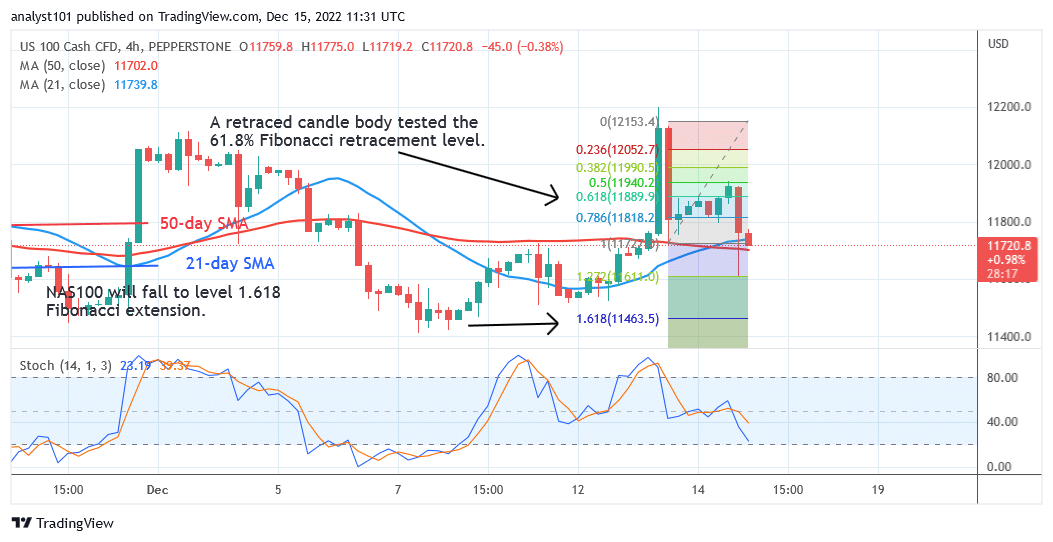
The NAS100 is in a bearish momentum on the 4-hour chart. The moving average lines are about to be broken by the bearish momentum. The NAS100 produced an upward corrective during the downturn on December 13 and a retraced candle body tested the 61.8% Fibonacci retracement level. According to the adjustment, NAS100 will drop to level 1.618 of the Fibonacci sequence, or level 11463.50.
4-hour Chart Indicators Reading
The NAS100 is moving in a negative direction below the daily Stochastic level of 40. The sideways-sloping 50-day line SMA and the 21-day line SMA both show a trend.
General Outlook for NASDAQ 100 (NAS100)
The NAS100 is moving downward as it faces further rejection. The downward momentum will continue as it reaches the level 11463.50 low. The NASDAQ will trend if the 50-day line SMA is violated.
You can purchase crypto coins here: Buy LBLOCK
Note: Learn2.Trade is not a financial advisor. Do your research before investing your funds in any financial asset or presented product or event. We are not responsible for your investing results
- Broker
- Min Deposit
- Score
- Visit Broker

- Award-winning Cryptocurrency trading platform
- $100 minimum deposit,
- FCA & Cysec regulated

- 20% welcome bonus of upto $10,000
- Minimum deposit $100
- Verify your account before the bonus is credited
- Fund Moneta Markets account with a minimum of $250
- Opt in using the form to claim your 50% deposit bonus
Learn to Trade
Never Miss A Trade Again

Signal Notification
Real-time signal notifications whenever a signal is opened, closes or Updated

Get Alerts
Immediate alerts to your email and mobile phone.

Entry Price Levels
Entry price level for every signal Just choose one of our Top Brokers in the list above to get all this free.